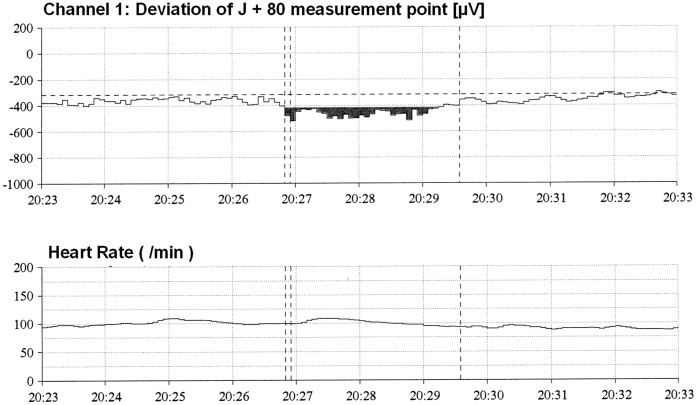
Figure 2. Automatic analysis of ST segment changes during Holter recording.
The upper image depicts the deviation of the J +80 measurement point (80 ms after J point) within a 10 minute period (pt. no. 7). At 20 h 26 min 50 s an ischemic episode of 2 min 45s duration was detected. J +80 measurement point deviation >100 µV is marked in black. The lower image depicts the corresponding heart rate (HR).

