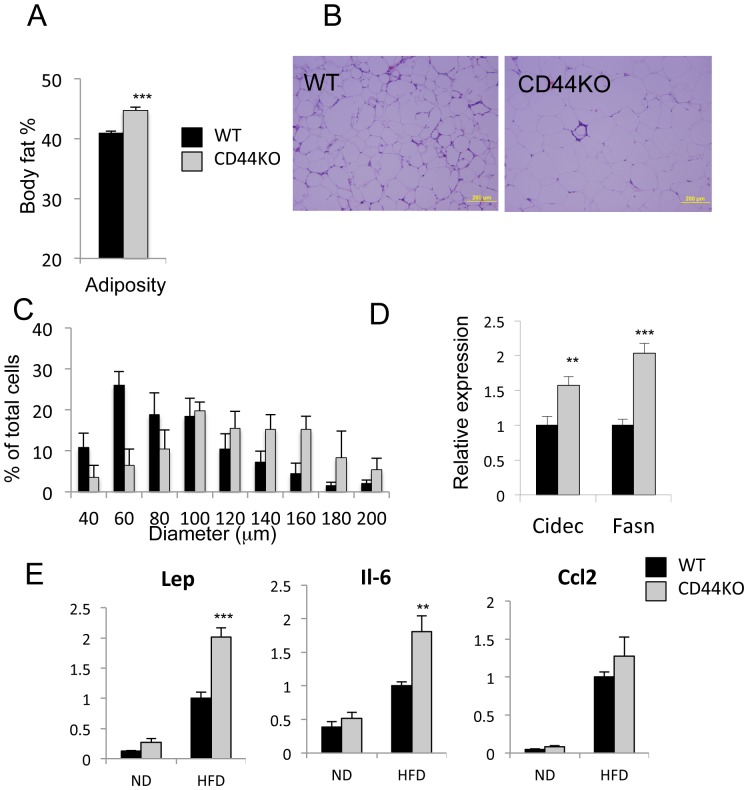
Figure 5. Total body fat was increased in CD44KO(HFD) compared to WT(HFD) mice.
A) Total body fat mass from mice fed a HFD for 21 weeks was analyzed by Piximus densitometry. B) Representative H&E stained sections of WAT were presented. Scale bar indicates 200 µm. C) Comparison of the cell size of WAT adipocytes from WT(HFD) and CD44KO(HFD). Cell diameters in sections of WAT from 4 mice in each group were measured and the percentages of the different cell sizes calculated and plotted. D) Increased Cidec and Fasn expression in WAT of CD44KO(HFD) compared to WT(HFD) mice (n = 5–6 mice per each group). E) Comparison of gene expression in WAT of WT or CD44KO mice fed a normal diet (ND) or a high fat diet (HFD) (n = 5–6 mice per each group).

