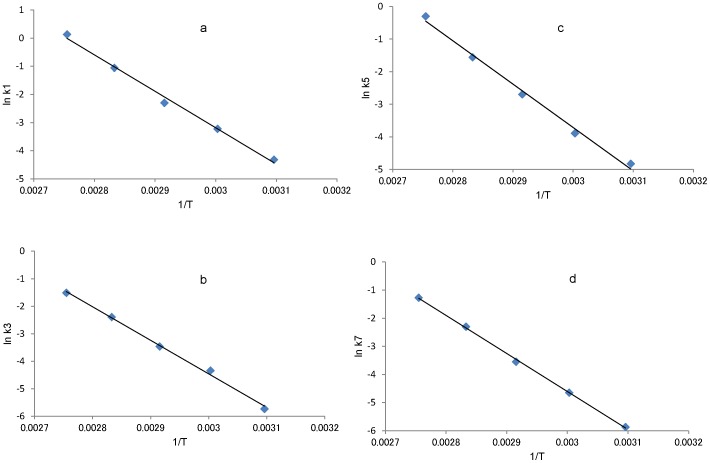
Figure 8. Arrhenius plots of the rate constant for dehydration from isomers to succinimide.
Figure 8a Arrhenius plot for k1. Figure 8b shows the Arrhenius plot for k3. Figure 8c shows the Arrhenius plot for k5. Figure 8d shows the Arrhenius plot for k7. Using the fitted line in this figure, we determined rate constants at 37°C.

