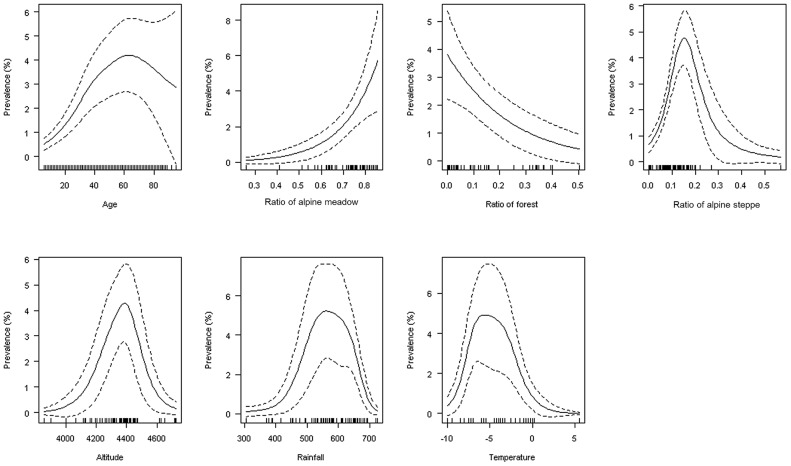
Figure 5. Relationships between age, environmental factors and AE status.
Predicted values (solid line) and 95% CI (dotted line) were computed using a general additive mixed model with a binomial link, a cubic regression spline smoothed term on age and a random effect on villages [29]. The rug on the abscissa represents the observations (some at the same position may overlap).

