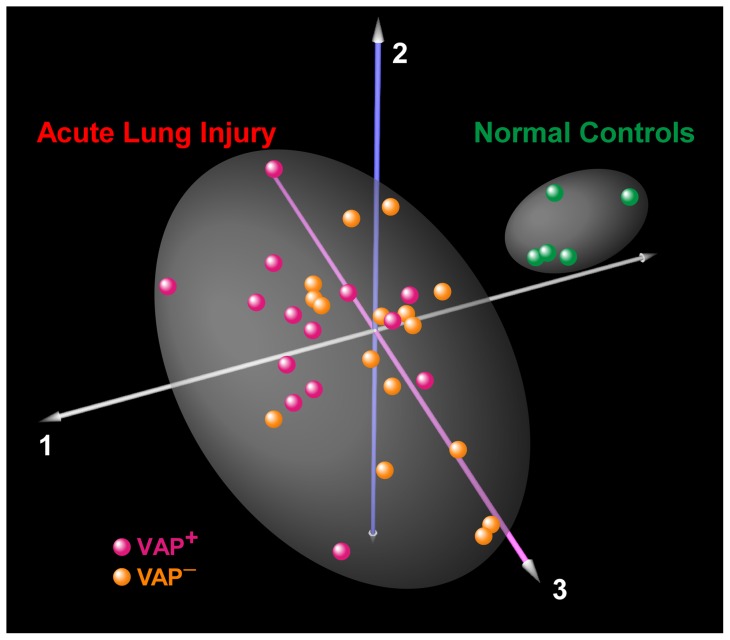
Figure 1. Correspondence analysis of BALF proteome in patients with ALI (n = 30) and healthy controls (n = 5).
Each sphere represents an individual whose location in “proteome space” is determined by BALF protein expression variability. Each axis represents a principal coordinate that captures a component of the variance in protein expression. As expected, ALI patients segregate from the controls, implying that lung injury elicits a global perturbation in airspace protein levels. However, within the ALI group, VAP+ and VAP– patients are not separated into distinct clusters.

