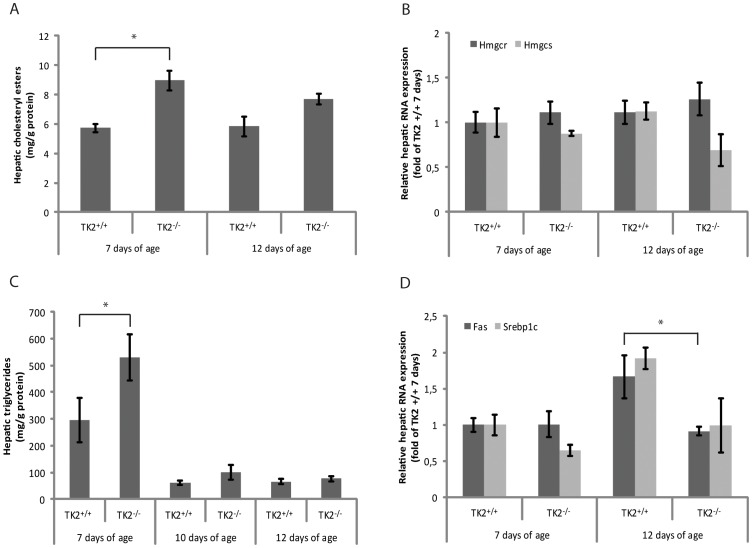
Figure 3. Hepatic gene expression and lipid content.
A) Hepatic cholesteryl esters in 7 and 12 days old TK2+/+ and TK2−/− mice determined with GC-MS. B) Relative hepatic mRNA expression of 3-hydroxy-3-methyl-glutaryl-Coenzyme A reductase (Hmgcr) and 3-hydroxy-3-methyl-glutaryl-Coenzyme A synthase (Hmgcs) in 7 and 12 days old TK2+/+ and TK2−/− mice determined with real-time PCR. C) Hepatic triglycerides in 7, 10 and 12 days old TK2+/+ and TK2−/− mice determined with an enzymatic assay. D) Relative hepatic mRNA expression of fatty acid synthase (Fas) and sterol regulatory element binding protein 1c (Srebp1c) in 7 and 12 days old TK2+/+ and TK2−/− mice determined with real-time PCR. Data presented as mean ± SEM. Statistically significant difference (two-tailed unpaired Student’s t-test) compared to TK2+/+ of the same age, *p≤0.05.

