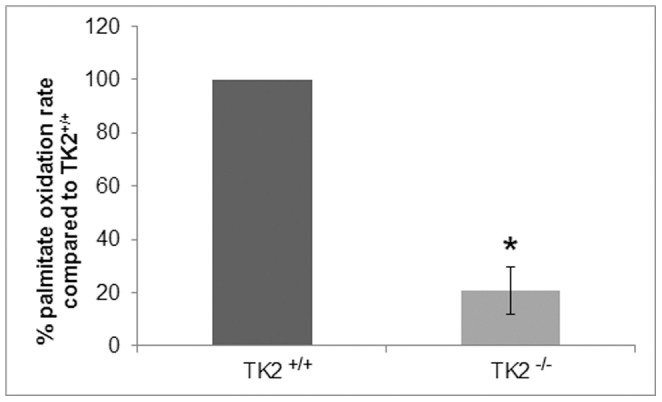
Figure 4. Mitochondrial palmitate oxidation rate in liver homogenates of 14 days old TK2+/+ and TK2−/− mice.

Three independent measurements were performed (TK2+/+ n = 3, TK2−/− n = 3) and comparisons between the genotypes were made within each measurement. Data presented as per cent activity (mean ± SEM) compared to TK2+/+. The P-value for statistical comparison (two-tailed unpaired Student’s t-test) between TK2+/+ and TK2−/− is shown, *p≤0.05.
