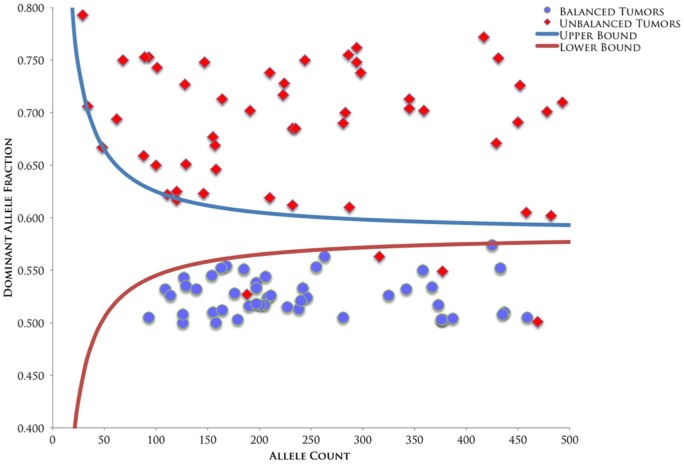
Figure 2. Sequential Probability Ratio Test (SPRT) analysis of CSMD1 based on digital allele counting.
The upper bound curve shown in the graph demonstrates the 95% CI threshold of CSMD1 loci being classified as unbalanced, whereas the lower bound curve demonstrates the 95% CI threshold of CSMD1 loci being classified as balanced. Tumors with two or more contiguous loci that were imbalanced were classified as having undergone loss of heterozygosity. Loci that fell between the two thresholds were deemed indeterminate for allelic characterization. Certain loci in CSMD1 demonstrated allelic balance, though they resided in tumors that were unbalanced for CSMD1. This result alludes to chromosomal breaks that occur within the CSMD1 gene sequence, downstream of the examined loci.

