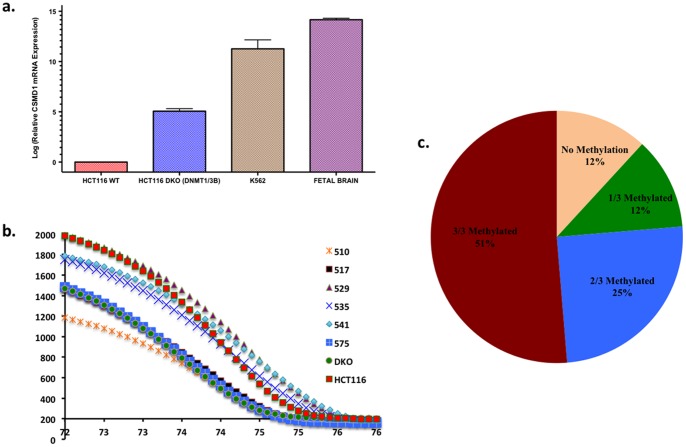
Figure 3. Determining CSMD1 methylation in colorectal tumors.
a.) CSMD1 mRNA expression comparison in HCT116 WT and HCT116 DNMT1/3B DKO cDNA along with K562 and fetal brain cDNA. b.) The high-resolution melt curve analysis distinguishes between methylated and unmethylated CG at Reference position 3265577 based upon their melt temperature. Tumor 517 was mutated at CG3265577 so the melt peak coincided with HCT-DKO whereas methylated tumors coincided with the HCT-116 peaks, which is our positive control c.) The percentage of colorectal tumors methylated at CSMD1 loci determined by methylation specific PCR melt curve analysis.

