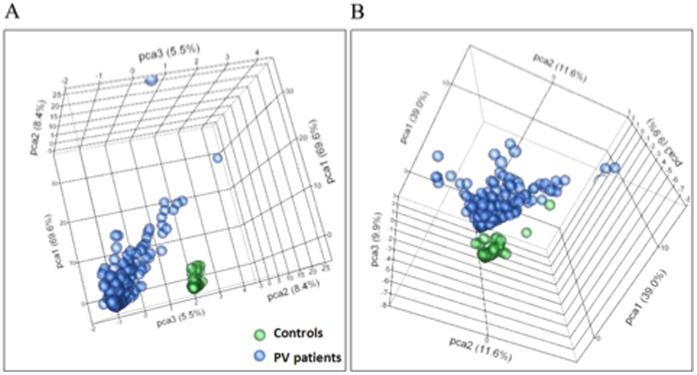
Figure 2. Principal component analysis of top antigens.
Unsupervised principal component analysis of the signal intensity for samples from PV patients and healthy controls revealed that these two groups could be segregated on the basis of top 30 antigens with the highest sensitivity (A) and 15 antigens with the highest specificity (B) for PV.

