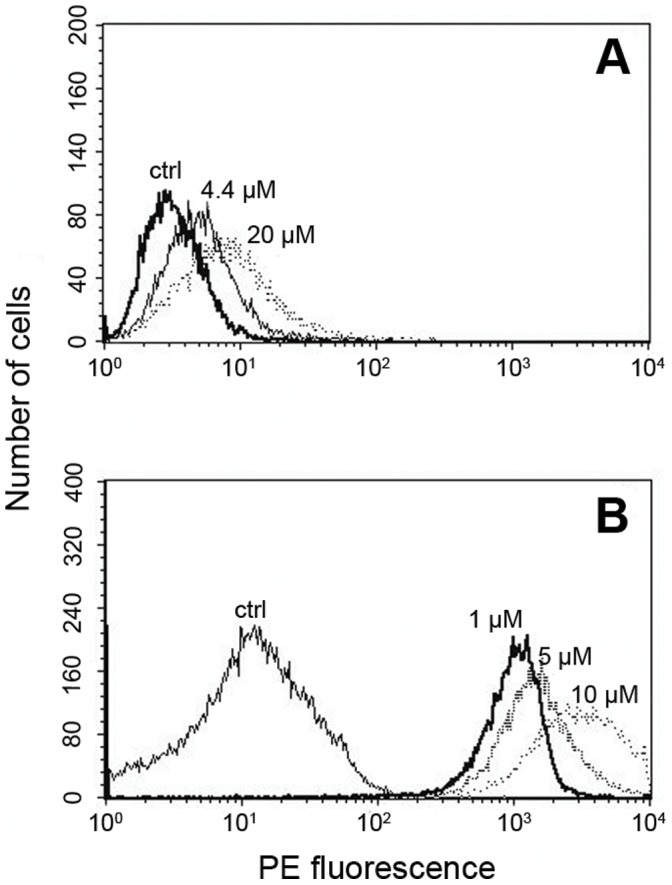
Figure 2. Detection of fibrillar Aβ1–42 induced Aβ1–40 production by flow cytometry.

For the analysis of Aβ1–40 synthesis in amyloidic condition, Hep-1 cells were treated with fibrillar Aβ1–42 in the presence (A) or absence (B) of serum, stained with anti Aβ1–40 antibodies (biotinylated) and streptavidin conjugated phycoerythrin. Histograms are shown for the control with no added amyloid (ctrl) and for cells incubated with various concentrations of Aβ1–42.as indicated in the figure.
