
Figure 4. Hystogram showing the values of the three tests scores and the metabolism in the cluster of voxels showing statistically significant hypometabolism at PET0 as compared to PET1 (A) and viceversa (B).
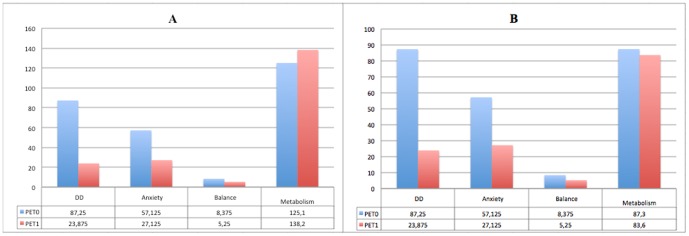
The mean of glucose metabolism values in the eight patients are expressed as percent of the values found in cerebellum.