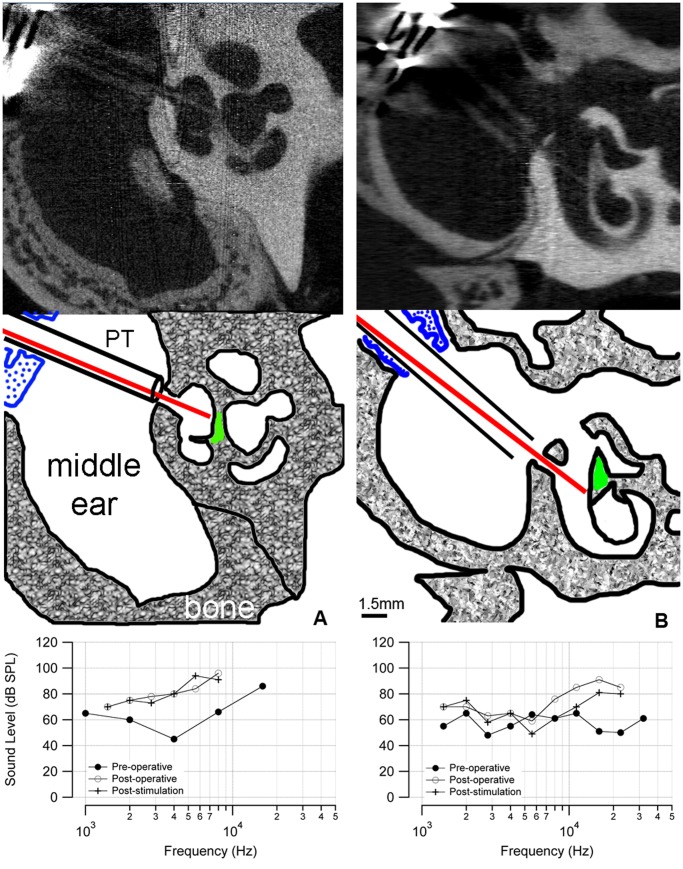
Figure 6. microCT images of chronically implanted cat cochleae.
(a) A microCT image of a stimulated cat cochlea shows the placement of the optical fiber. The diagram (middle) indicates the optical fiber (red) passing through the cochleostomy that has been drilled in the bony cochlear wall. The optical fiber is directed towards the spiral ganglion neurons (green). The distance between the tip of the optical fiber and the spiral ganglion neurons was 200 µm. The optical fiber is sheathed in plastic tubing (PT) that passes through the metal bulla mount (blue) to secure the assembly to the bulla. The aABR threshold (bottom) shows an ∼30 dB elevation at high frequencies. (b) The microCT of a control cochlea shows that the optical fiber is inserted through a cochleostomy in the basal turn of the cochlea but is not pointed towards the spiral ganglion cells. Neither a behavioral nor electrophysiological response was observed in this animal. The distance between the tip of the optical fiber and the spiral ganglion neurons was 200 µm. The ABR threshold shows an ∼30 dB elevation at high frequencies. The difference in ABR thresholds below 10 kHz between the animals could be caused by variations in the surgical implantation or individual wound healing responses.

