
Figure 5. Exon 12 in Fmr1 transcripts from mouse brain and cultured progenitor cells.
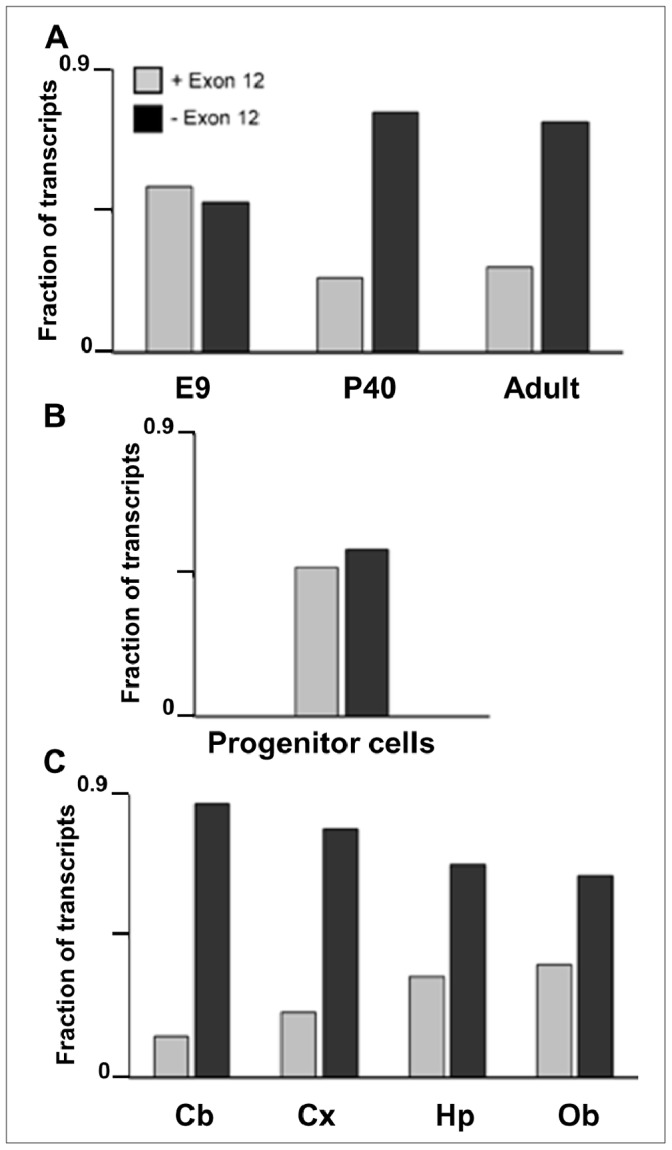
The levels of the abundant Fmr1 transcripts were measured in [A] embryonic day 9 (E9), postnatal day 40 (P40) and adult mouse brains, in [B] cultured neural stem/progenitor cells, and in [C] dissected regions of adult mouse brain [cerebellum (Cb), cortex (Cx), hippocampus (Hip), and olfactory bulb (Ob)]. The data are presented as the fractions of Fmr1 transcripts containing (gray bars) and lacking (black bars) Exon 12 (eg. “+ Exon 12″ is the sum of Isoforms 1–3 divided by the sum of Isoforms 1–3 plus 7–9). Error bars for the individual isoforms are found in Fig. 1 for adult whole brain, in Fig. 4 for E9 and P40, in Fig. 6 for cultured neural stem/progenitor cells, and in Figs. 7 and 8 for individual brain sections.