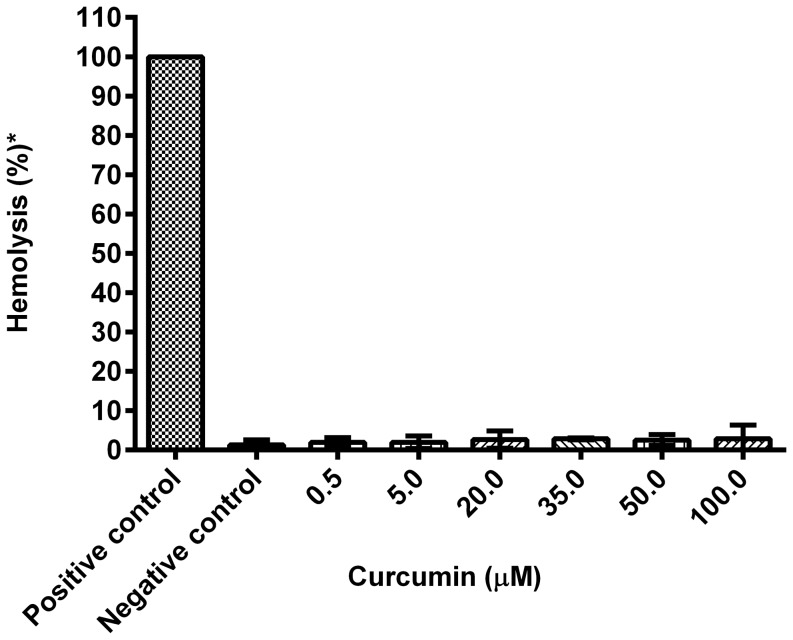
Figure 3. Percentage hemolysis at different concentrations of curcumin.
Erythrocytes were resuspended in isotonic PBS (137 mMNaCl, 2.7 mMKCl, 10 m Na2HPO4, 1.76 mM KH2PO4, pH 7.0) (positive control), deionised water (negative control), and different concentrations of curcumin. * Hemolysis was measured as a % of positive control. Error bars represent standard error of the mean (n = 6).

