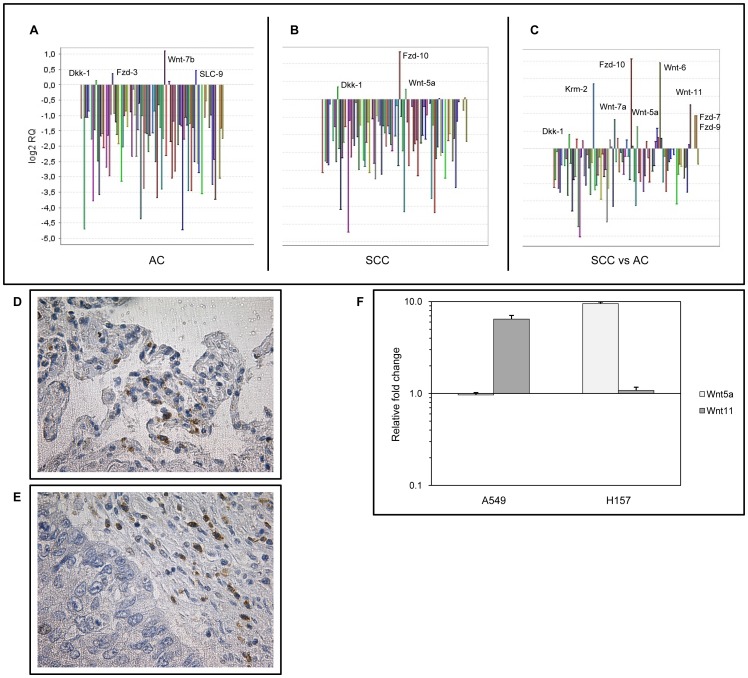
Figure 1. Level of Wnt signalling molecules in AC and SCC.
Pooled cDNA of 12 AC, 8 SSC samples were targeted to gene expression analysis using a commercially available Taqman array. Four housekeeping genes were used (18S, GAPDH, HPRT1, GUSB). A: Expression profile of AC. Pooled cDNA of autologous normal tissue samples of the same AC patients served as reference. Note the increased level of the canonical Wnt-7b, and the receptor Fzd-3. (For the list of all gene expression changes see Table S1). B: Gene expression levels of SCC. Pooled cDNA of autologous normal tissue samples of the same SCC patients served as reference. Note the upregulation of the non-canonical Wnt5a and the canonical pathway inhibitor Dkk-1, along with increased level of Fzd-10 gene expression. (For the list of all gene expression changes see Table S2). C: Gene expression of SCC compared to AC. Note the increased level of non-canonical Wnts (Wnt5a and Wnt11), several receptors (Fzd-7, -9, -10), a canonical pathway inhibitor (Dkk-1) and an inhibitory receptor (Krm2). (For the list of all gene expression changes see Table S3). D and E: Immunohistochemical staining of primary control (Panel D) and AC (Panel E) tissues for Wnt11. Note the higher Wnt11 expression in the tumours emphasizing the relative nature of the initially identified differences at mRNA level. Images shown are representatives of three independent stainings. F: Wnt11 gene transcription was also measured in an AC (A549) and an SCC (H157) cancer cell line. Note the higher Wnt11 levels in the observed cancer cell lines compared to the normal, non-cancerous pulmonary epithelium (SAEC). The AC cell line showed a more pronounced increase in Wnt11 expression than the SCC cell line. (The results are representative of three independent experiments where the non-cancerous control (SAEC) was derived from three individual donors of different ages).

