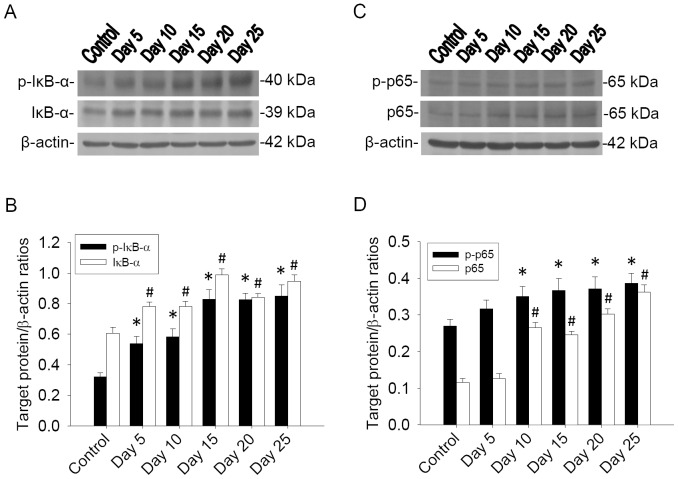
Figure 1. Time-course studies for p-IκB-α and p-NF-κB p65 in mouse brain (A and C).
Protein bands of p-IκB-α, IκB-α, p-NF-κB and NF-κB from the brain of mice (n = 5) infected with A. cantonensis. β-actin was used as a loading control. (B and D) Quantification and normalization to β-actin showed significant increases not only in p-IκB-α and IκB-α (*P<0.05) but also in p-NF-κB p65 and NF-κB p65 (# P<0.05). Bars represent mean ± S.D. from three independent experiments performed in duplicate.

