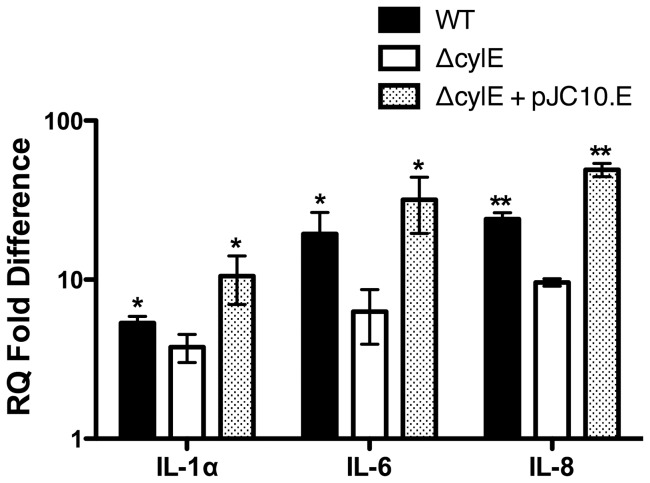
Figure 1. GBS βH/C is important for induction of cytokine mRNA in human bladder epithelial cells.
Monolayers of 5637 cells were exposed to medium alone, WT, ΔcylE, or complemented GBS strains for 1 h. Transcript levels for different proinflammatory cytokines were determined using qRT-PCR with normalization to GAPDH. RQ values were calculated by comparative CT (ΔΔCT), and fold difference over transcript levels in bacteria exposed to medium alone was determined. RQ fold difference values from triplicate readings in a representative experiment (from three biological replicates) ± standard deviation are shown. WT and complemented strains were compared to ΔcylE by two-tailed t tests. (P values for this and subsequent figures are denoted as follows: *, P≤0.05, **, P≤0.01, while NS refers to P>0.05).

