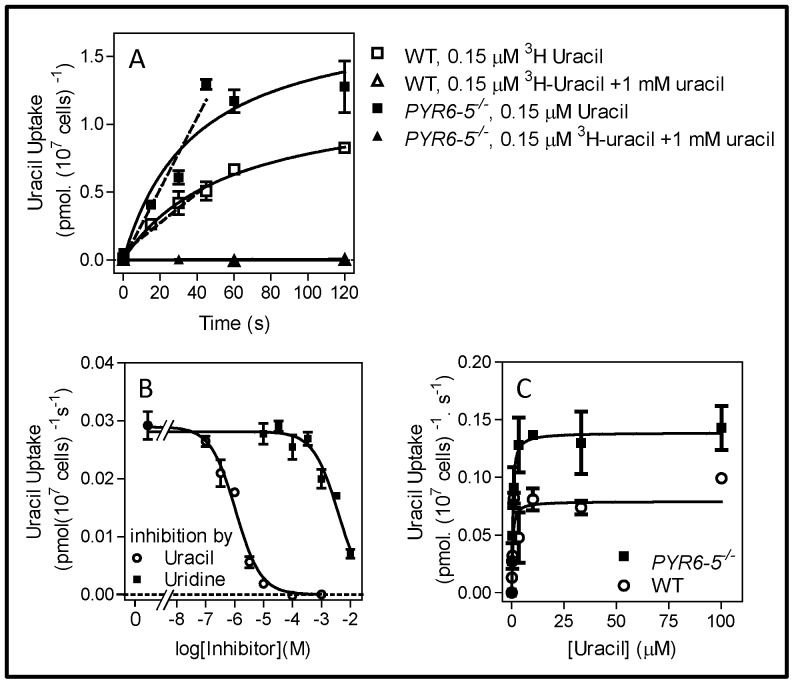
Figure 4. Uracil transport by T. b. brucei bloodstream forms.
(A) Timecourse of 0.15 µM [3H]-uracil uptake by WT s427 and by PYR6-5 −/− cells, in the presence or absence of 1 mM unlabelled uracil, as indicated. Dashed lines represent linear regression over the first 50 s, yielding correlation coefficients of 0.97 and 0.92 for the knockout and WT strains, respectively. In the presence of excess unlabelled uracil uptake was not significantly different from zero (F-test) for both strains. The experiment shown is representative of three identical experiments with highly similar outcomes and shows average and SE of triplicate determinations. In the presence of 1 mM uridine, the lines for WT and PYR6-5 −/− were superimposed. (B) Uptake of [3H]-uracil by PYR6-5 −/− trypanosomes was measured over 30 s in the presence or absence of unlabelled uracil (○) or uridine (▪) at the indicated concentrations. The data was plotted to a sigmoid curve with variable slope which in the case of uridine inhibition was set at zero for its minimum. The data are the average and SE of triplicate determinations and the experiment shown is representative of several independent experiments with essentially identical outcomes. (C) Michaelis-Menten saturation plots for uracil uptake of [3H]-uracil by WT (○) or PYR6-5 −/− (▪) T. b. brucei bloodstream forms. The data represents the average and SE of three identical experiments, each performed in triplicate.

