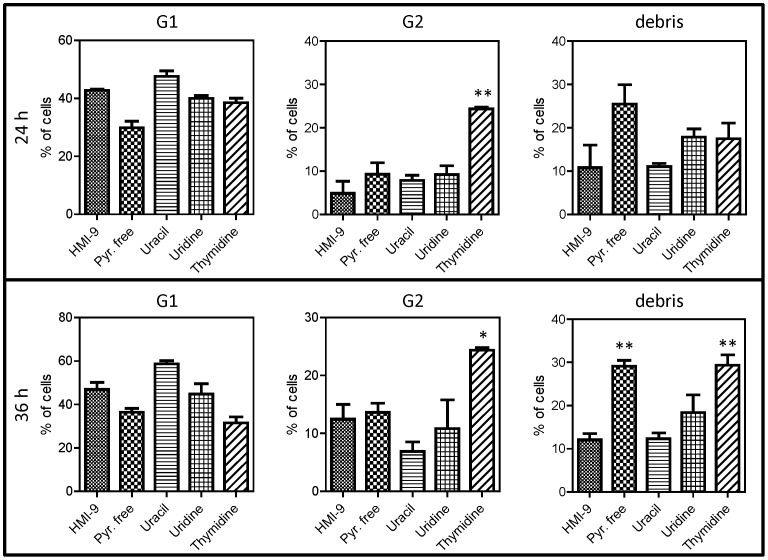
Figure 7. Quantitative analysis of DNA content in pyrimidine-starved trypanosomes.
The peak area of G1, G2 and debris of flow cytometric analysis of DNA content (Fig. 6) was determined using the ModFit software package after 24 or 36 of growth under various culturing conditions. Growth was in HMI-9 (control) or in HMI-9-tmd with or without the addition of 100 µM of one pyrimidine as indicated. The data are the average of 3–6 independent determinations and statistical analysis was performed using one-way ANOVA with Tukey's correction (Prism 5, GraphPad). *, P<0.05; **, P<0.01.

