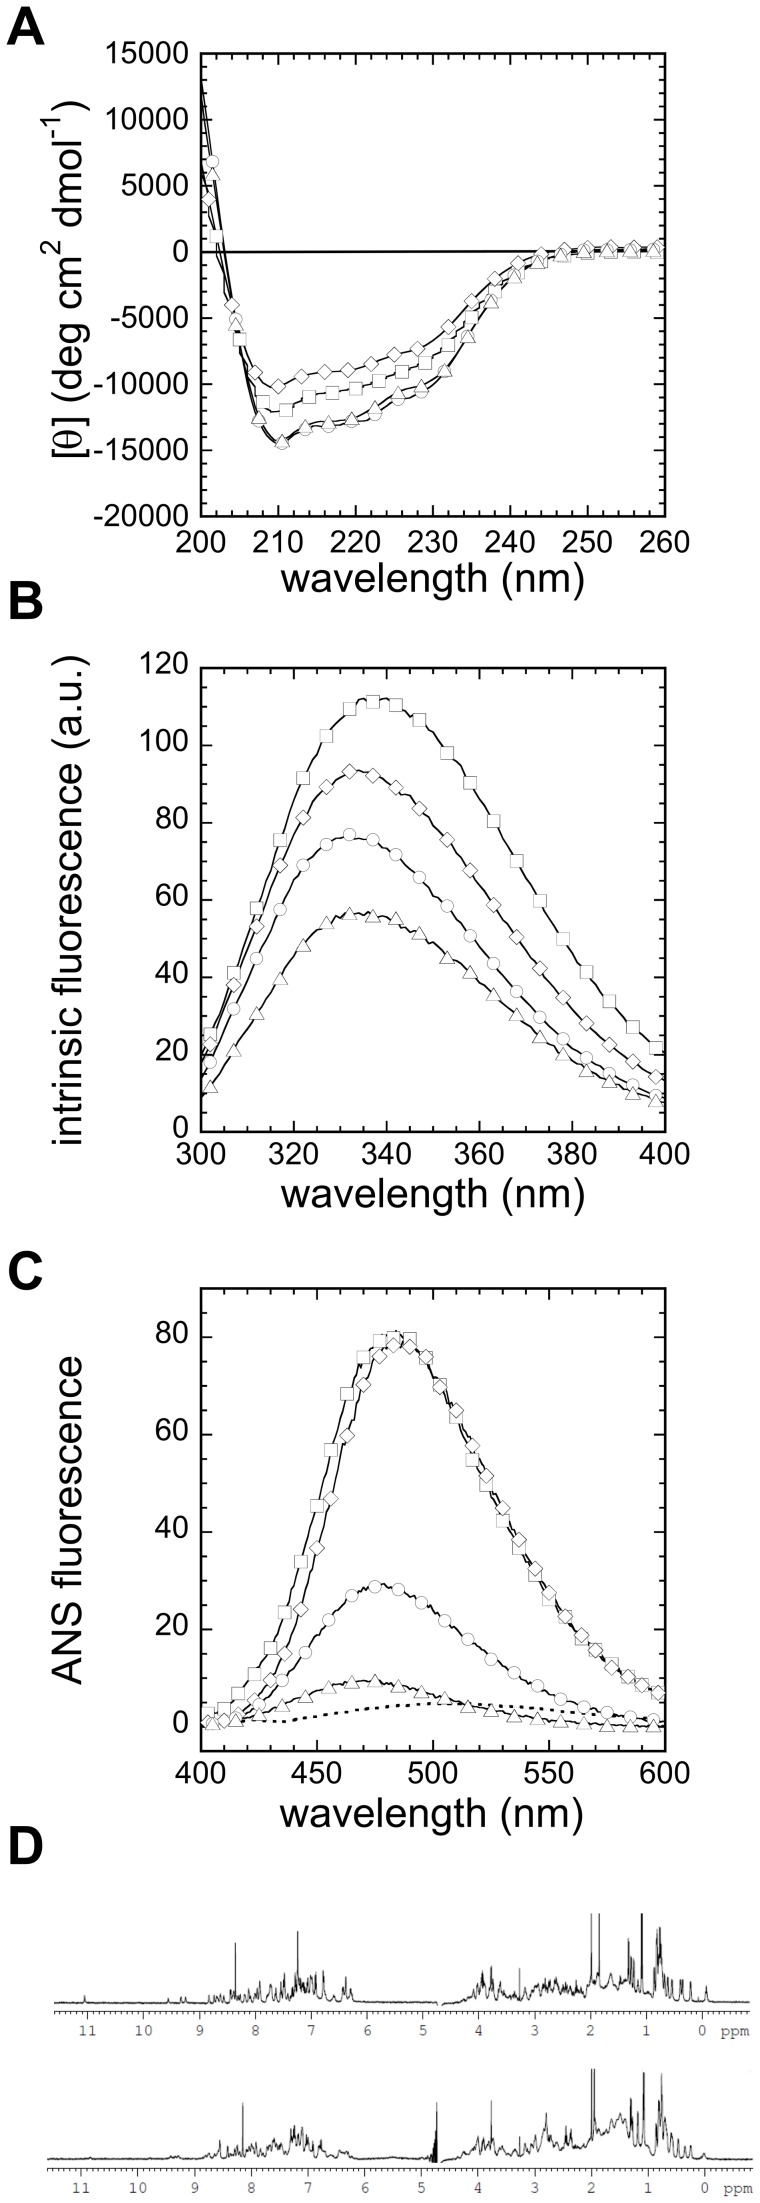
Figure 2. pH dependence of URN1-FF conformational properties.
Protein samples were prepared at 20 µM and were immediately measured by (a) far-UV CD, (b) tryptophan intrinsic fluorescence and (c) ANS fluorescence at 298 K. The fluorescence emission spectrum of ANS in the absence of protein is represented as a dotted line. URN1-FF species were at pH 2.0 (squares), pH 2.5 (diamonds), pH 3.0 (circles), and pH 5.7 (triangles). (d) One-dimensional NMR (1H-NMR) spectra of URN1-FF were recorded at 298 K and 600 MHz, using a protein concentration of 35 µM. Two different spectra were collected, at pH 5.7 (above) and pH 2.5 (below).

