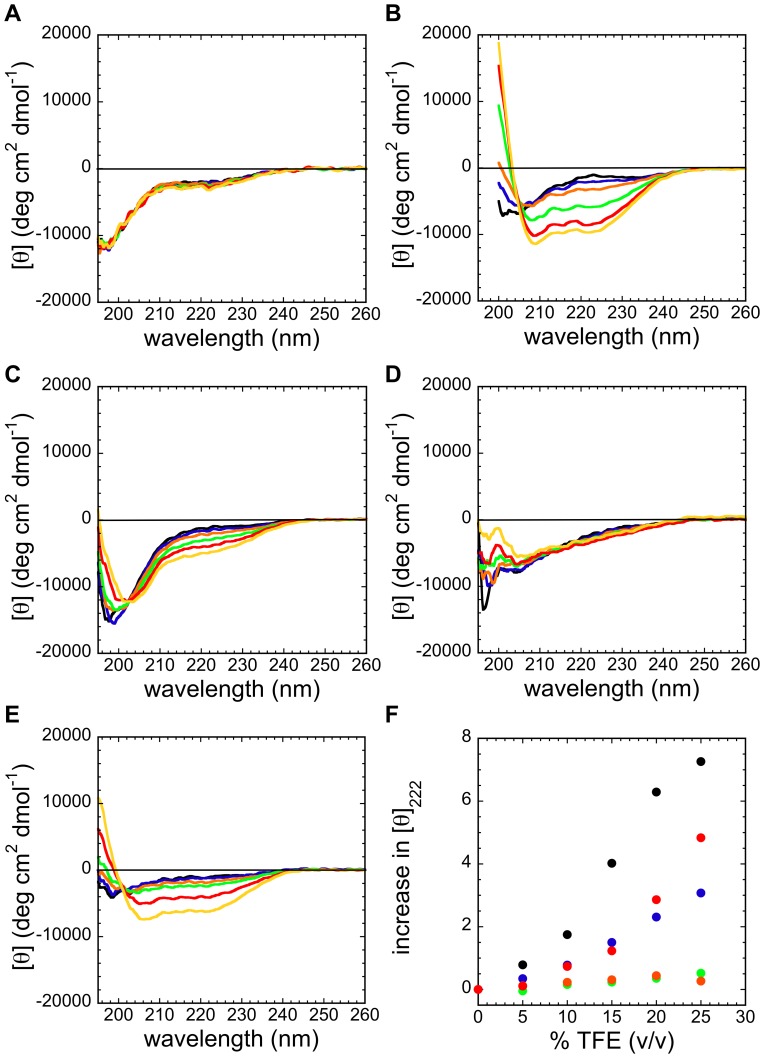
Figure 8. α-helical structure of synthetic URN1-FF peptides.
Synthetic peptides were prepared at 100 µM and pH 2.5. Their far-UV CD spectra were recorded at 298 K in the absence (black) and in the presence of different percentages (v/v) of TFE: 5% (v/v) (blue); 10% (v/v) (orange); 15% (v/v) (green); 20% (v/v) (red); and 25% (v/v) (yellow). (a) Nt, (b) H1, (c) H2, (d) 310 and (e) H3 peptides. (f) Increase in the molar ellipticity at 222 nm versus the TFE concentration for all the synthetic peptides: Nt (green); H1 (black); H2 (blue); 310 (orange) and H3 (red) peptides. The Y axis corresponds to the difference between each value and the value at 0% of TFE, divided by the value in the absence of TFE for each peptide.

