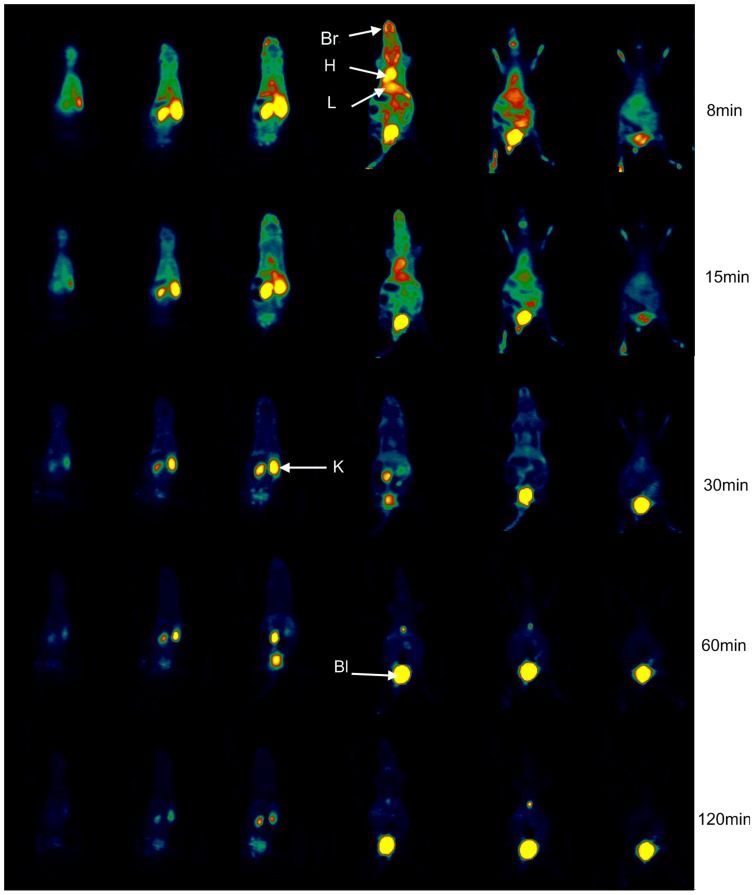
Figure 5. PET imaging results by intravenous administration of 18F-CML.
Representative serial coronal whole-body dynamic PET images obtained from dynamic small animal PET scans showing the [18F]-radioactivity distribution at different times. From left to right horizontally, the mouse is shown in consecutive slices from dorsum to belly; from up to down vertically, the mouse is shown in slices at 8, 15, 30, 60 and 120 min after injection of 18F-CML. Colours indicating the measured dose of radioactivity range from black (no activity) through green, red and yellow (highest activity). H, heart; L, liver; Bl, bladder; K, kidney; Br, brain.

