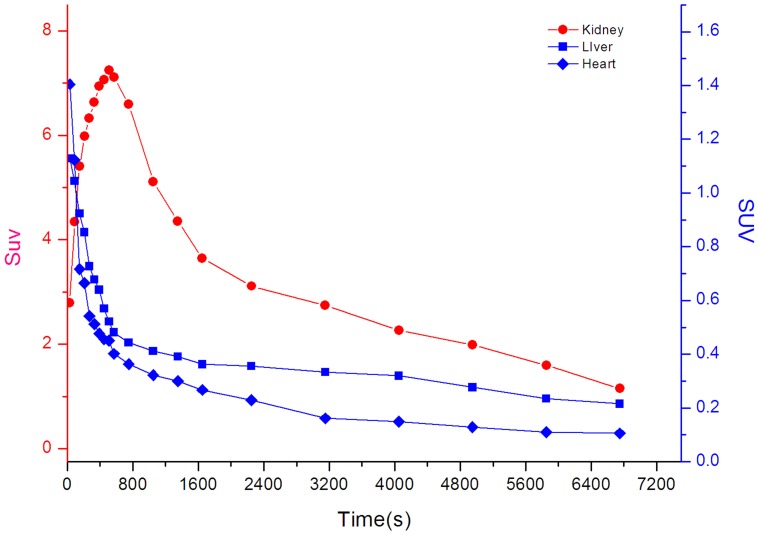
Figure 6. Representative time-activity double-Y axis curves of major organs (kidneys, liver and heart) derived from 120-min dynamic PET scans after intravenous administration of 18F-CML tracers.
The kinetics of the radioactivity were calculated from a region-of-interest analysis of the dynamic small animal PET scans over the heart (diamond; mainly representing the cardiac blood pool), kidney (circles) and liver (squares). The left-Y axis data represent the kidneys, and the right-Y axis data represent the liver and heart.

