
Fig. 2.
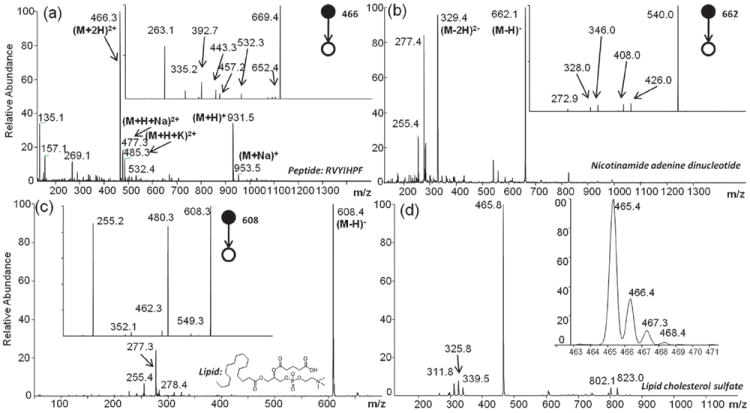
Paper spray mass spectra of analytes deposited on paper wetted with n-hexane. (a) Angiotensin III (500 ng), mass spectrum and MS/MS product ion spectrum of (M + 2H)+ ion. (b) Nicotinamide adenine dinucleotide (500 ng); insets are isotopic distribution of molecular ion and MS/MS spectrum of the (M – H)− ion. (c) 1-Palmitoyl-2-glutaryl-sn-glycero-3-phosphocholine (500 ng); insets are isotopic distribution of molecular ion and MS/MS spectrum of the (M – H)− ion. (See ESI†, Fig. S5 for positive ion mode spectrum.) (d) Cholesterol sulfate (3 ng), insets are isotopic distribution of molecular ion and MS/MS spectrum of the (M – H)− ion.