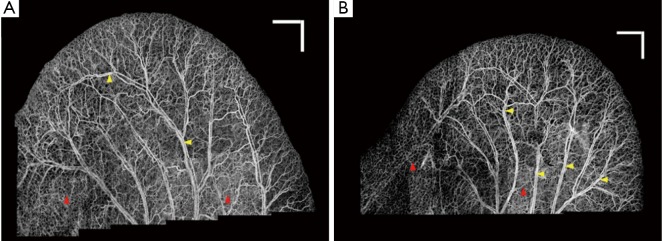
Figure 1.

OMAG images of two mouse ear vasculature maps after stitching 22 (A) and 29 (B) mosaics. The background is inhomogeneous and the signal strength and contrast at small vessels and capillary loops is low (red arrows). Also, some larger vessels are saturated (yellow arrows)
