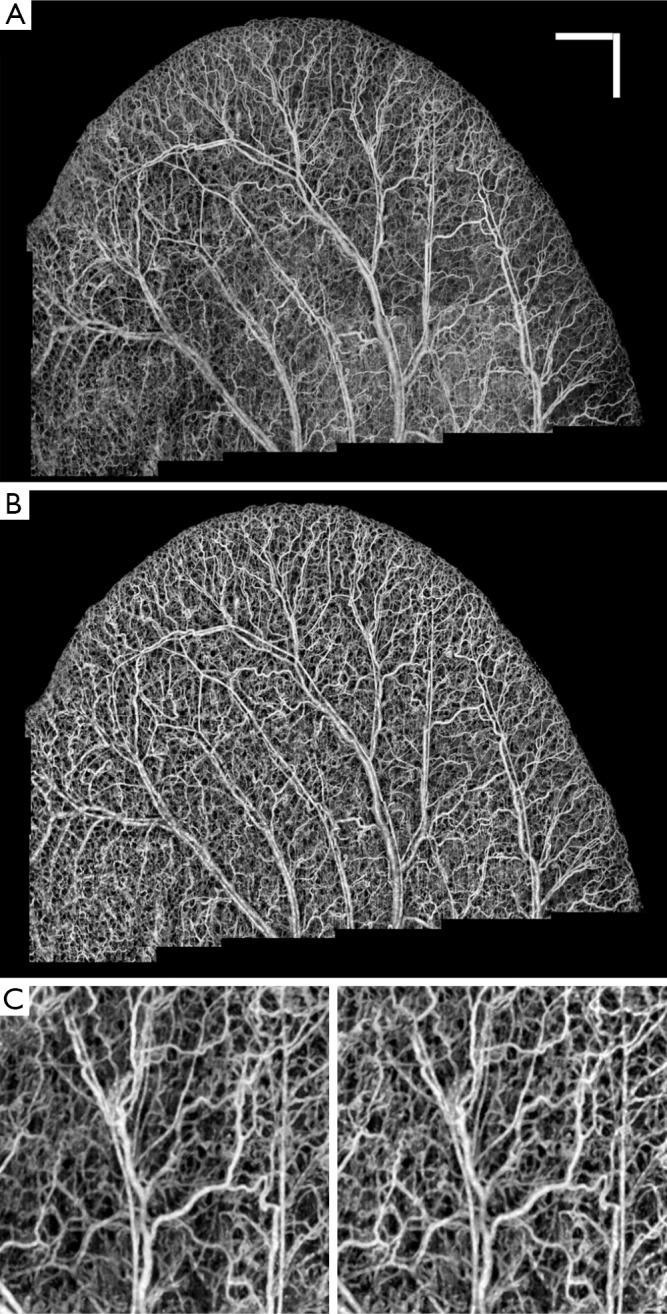
Figure 4.

A. OMAG microvasculature map of mouse ear pinna after stitching 22 projection map images (mosaics) without applying any post-processing to this image; B. After performing RCLAHE on each mosaic and stitching the images together; C. One of the mosaics of Figure 3A where the vessel map and background is not homogenous; D. RCLAHE enhanced mosaic. Scale bar =1 mm and each mosaic is 2.2 mm × 2.2 mm
