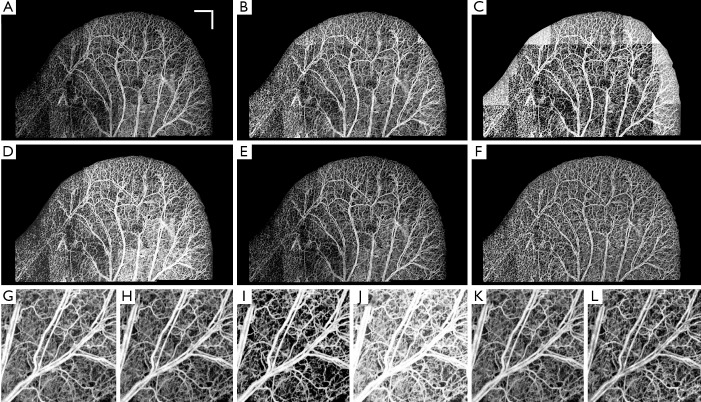
Figure 7.
(A) The original ear pinna image without any equalization. The performance of CSA (B), LHE (C), GHE (D), UCLAHE (E) and RCLAHE (F) methods on Figure 6A, respectively. The performance of each method on a selected mosaic where the mosaics are the result of no enhancement (G), CSA (H), LHE (I), GHE (J), UCLAHE (K) and RCLAHE (L) methods, respectively. Scale bar =1 mm and each mosaic is 2.2 mm × 2.2 mm

