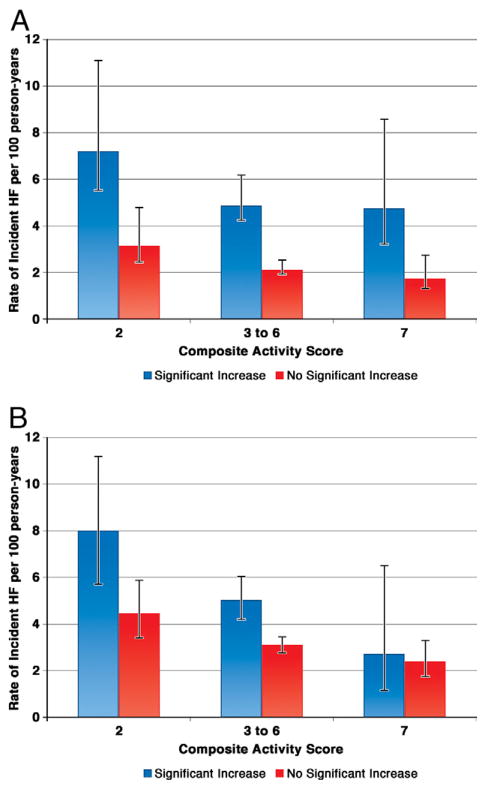
Figure 3. Rate of Incident HF.
(A) Examined by baseline composite physical activity score and subsequent increase in NT-proBNP. Error bars represent 95% confidence intervals. Tests for trend across activity groups: p = 0.02 for a significant increase in the NT-proBNP group and p = 0.001 for no significant increase in the NT-proBNP group. (B) Examined by baseline composite activity score and subsequent increase in cTnT. Error bars represent 95% confidence intervals. Tests for trend across activity groups: p = 0.002 for a significant increase in the cTnT group and p = 0.005 for no significant increase in the cTnT group. HF = heart failure; other abbreviations as in Figure 2.

