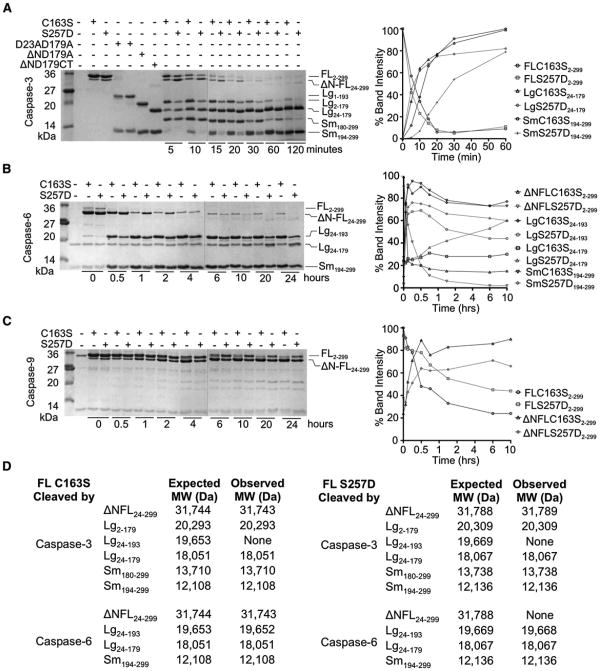
Figure 3. S257D Cleavage Patterns Suggest a Substrate-Binding Groove that Is Ordered Differently from Wild-Type Caspase-6.
(A–C) One percent active caspase-3 (A), 10% caspase-6 (B), or 40% caspase-9 (C) were used. The ratio of active caspase to inactive substrate was selected so that the same number of units of active caspase-3, -6 or -9 were present in all reactions. The dotted vertical lines indicate the edges of two gels used for analysis. Gel bands quantified as disappearance of uncleaved full-length procaspase-6 C163S, full-length caspase-6 S257D, or full-length procaspase-7 C186A were set to 100% or as appearance of cleaved products. Although all bands were measured, only quantification of the large and small subunits are shown, for clarity.
(A) Caspase-3-mediated cleavage of caspase-6 C163S zymogen or S257D phosphomimetic. Control constructs expressing defined domains D23A/D179A, ΔN D179A, and ΔN D179 CT are presented for comparison of the electrophoretic mobility of caspase-6 fragments produced at the indicated time points. Fragments resulting from caspase-3-mediated cleavage at the 20 min time point were assessed by mass spectrometry to identify precise cleavage sites. Full length (FL), FL lacking the N-terminal prodomain (ΔN-FL), large (Lg), and small subunits (Sm) with the amino acids present in those bands (subscripts) are labeled. (B) Caspase-6-mediated cleavage of caspase-6 C163S zymogen or S257D phosphomimetic are shown at the indicated time points. Fragments resulting from caspase-3-mediated cleavage at the 2 hr time point were assessed by mass spectrometry to identify precise cleavage sites. Fragment labels are as in (A). (C) Caspase-9-mediated cleavage of caspase-6 C163S zymogen or S257D phosphomimetic at the indicated time points. Fragment labels are as in (A).
(D) Masses of caspase-6 fragments produced by active caspase-3 or active caspase-6 analyzed by mass spectrometry. Expected molecular weights (MW) were calculated using the average isotopic masses of the amino acids translated from the DNA sequences of the expression constructs. The N-terminal methionine was cleaved during bacterial expression, resulting in the presence of Lg2-179. The observed MW were measured after 20 min of cleavage by caspase-3 or 2 hr of cleavage by caspase-6.

