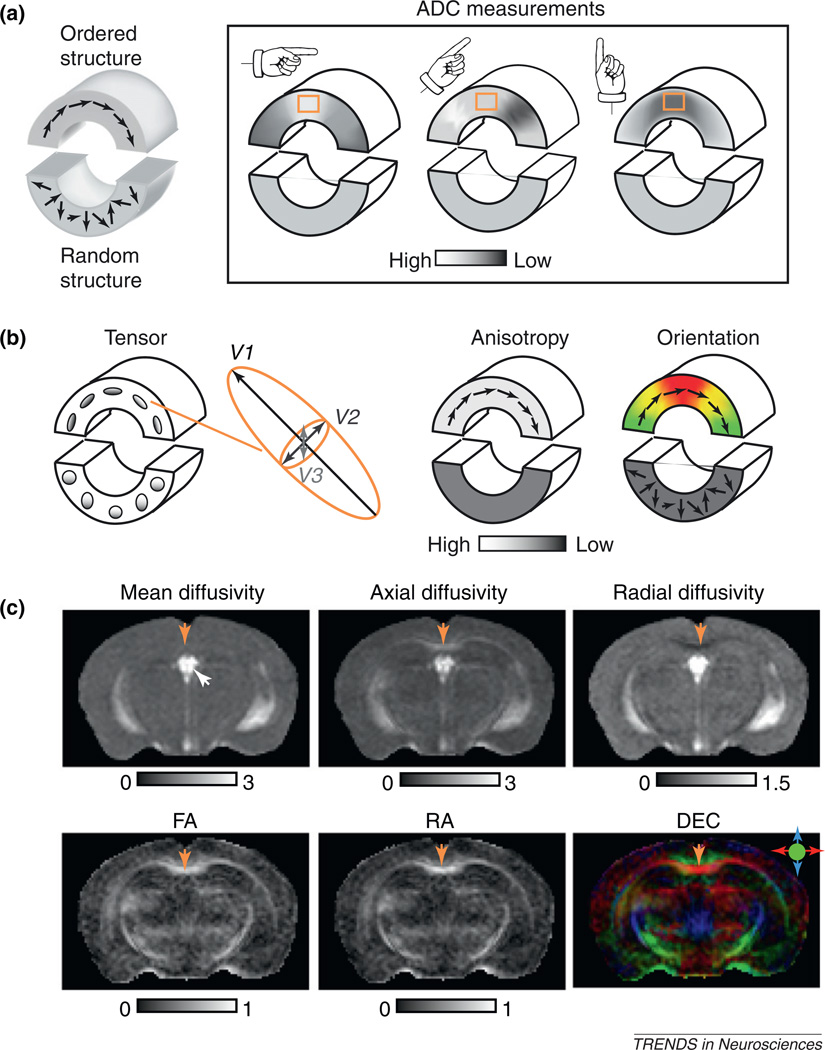
Figure 1.
From diffusion anisotropy to diffusion tensor. (a) A 2D diagram illustrating diffusion anisotropy [39]. The phantom in the diagram consists of an upper part that contains ordered structures (e.g. a bundle of axons or well-organized neurons) with coherent tissue orientations (represented by the arrows) and a lower part that contains random structures without coherent orientations. When measuring ADC along three different orientations, ADC measurements in the upper part show orientation dependence (i.e. anisotropic diffusion). For example, ADC values measured in the orange box change from high to low when the measuring orientation changes from horizontal to vertical. In comparison, ADC measured in the lower part does not show this orientation dependence. (b) Diffusion tensors visualized as ellipsoids and rendered as anisotropy and orientation-encoded color maps. The size, shape, and orientation of each ellipsoid are dictated by the eigenvalues and eigenvectors of the corresponding diffusion tensor. In the anisotropy map, the upper part of the phantom has higher diffusion anisotropy than the lower part. When diffusion anisotropy is high, the long axes of the diffusion tensor often coincide with the underlying structural orientation and can be visualized using a direction-encoded color map (DEC). In this 2D example, regions with structural orientation running horizontally are red and those running vertically are green. Transition areas become yellow, a mixture of red and green. Note that the technique cannot distinguish afferent and efferent axonal tracts. (c) DTI contrasts in the mouse brain. In the mean diffusivity image, the cerebral spinal fluid in the ventricle (indicated by the white arrow) appears bright while the mouse brain parenchyma appears rather homogeneous. The axial diffusivity and radial diffusivity images show more contrasts between gray- and white-matter structures than the mean diffusivity image. The CC (indicated by yellow arrows) has higher axial diffusivity values and lower radial diffusivity values than the neighboring cortical regions. In the FA and RA images, major white-matter structures, such as the CC, can easily be distinguished from gray-matter structures by their high anisotropy values. In the DEC image, major white-matter tracts are accentuated by their high anisotropy (reflected by their intensities) and color-coded orientations. The color scheme is: red, left–right; green, rostral–caudal; and blue, superior–inferior. The CC appears red in the DEC image because most fibers in the CC are arranged along the left–right orientation. The unit for mean, axial, and radial diffusivity is µm2/ms. FA and RA are unitless. DTI images adapted, with permission, from [16,34].

