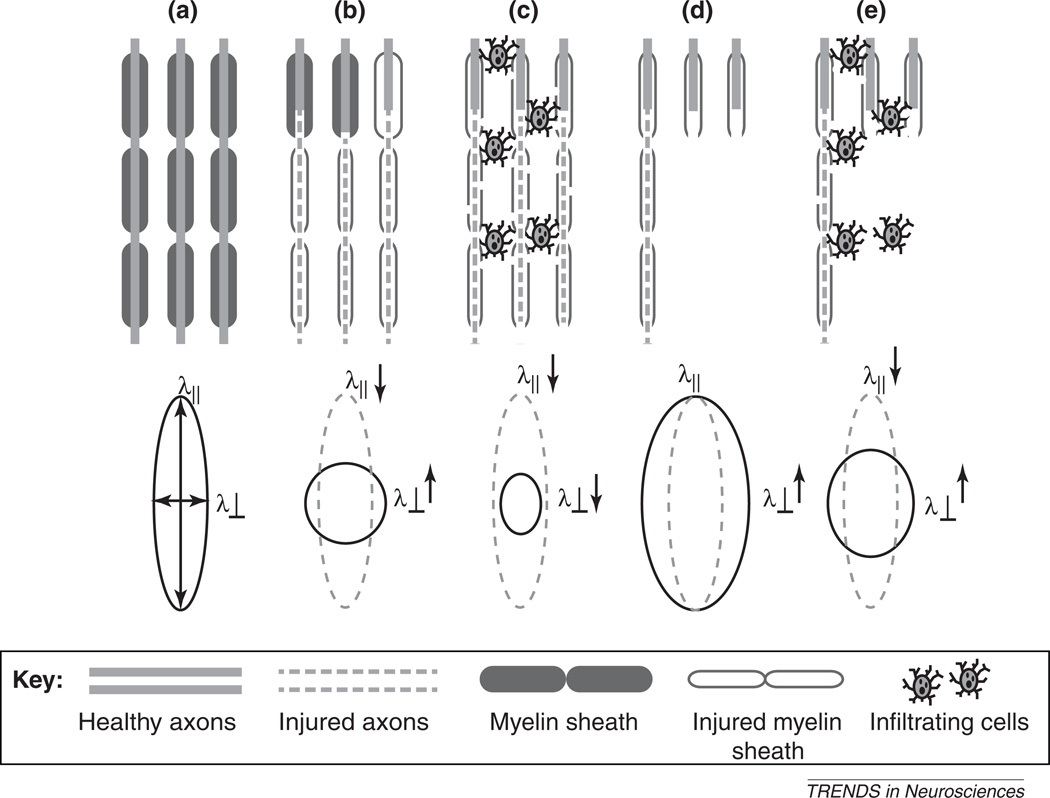
Figure 3.
Schematic diagrams illustrating how complex neuropathology can affect DTI results. (a) Normal myelinated axons and the corresponding diffusion tensor and axial and radial diffusivity (λ‖ and λ⊥, respectively). The diffusion tensor is represented by the ellipsoid here, and is shown in subsequent plots as a grey ellipsoid with dashed lines. (b,c) Axon and myelin injury with and without cell infiltration. (d,e) Axon and myelin injury with axonal loss, with and without cell infiltration. Adapted, with permission, from [35].

