Figure 4.
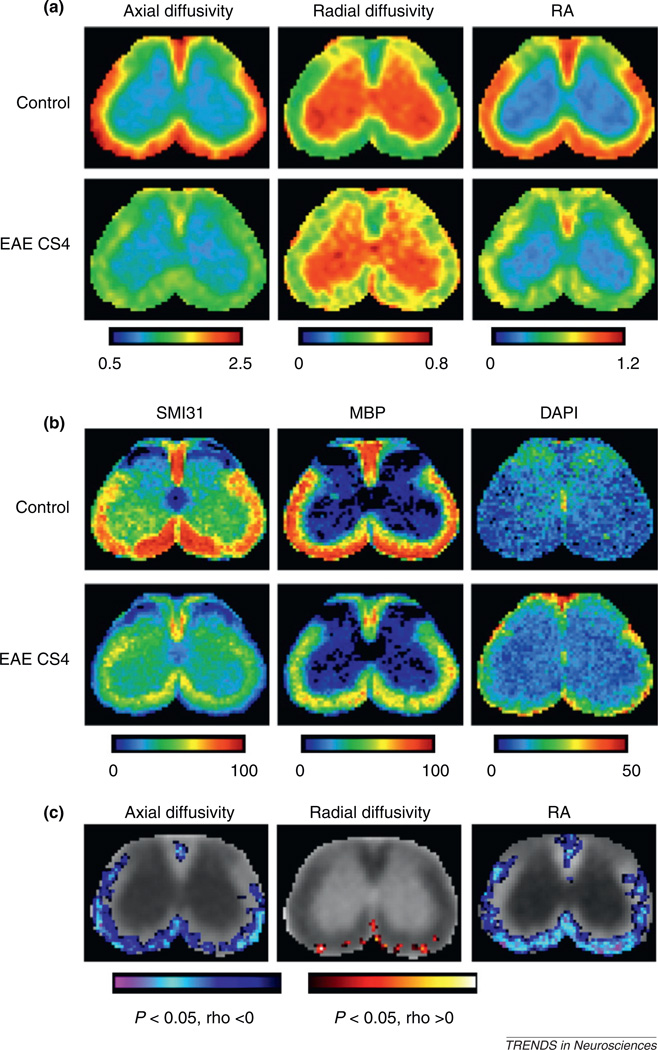
Co-registration of histological and DTI images allows detailed analysis of the relationships between histological and DTI markers. (a) Average maps of axial diffusivity, radial diffusivity, and relative anisotropy (RA) of the lumbar spinal cord from control mice and mice with severe EAE (clinical score of 4, CS4) [18]. The maps show reduced axial diffusivity and RA values in spinal-cord white matter, especially in the ventrolateral part, of mice with severe EAE compared to control mice. The maps also show increased radial diffusivity values, but with a sporadic pattern. The unit for axial and radial diffusivity is µm2/ms. The color code in these images indicates RA and diffusivity values in the spinal cord, with red indicating the highest levels of RA and diffusivity. (b) Average histological images stained for phosphorylated neurofilament (SMI31), myelin basic protein (MBP), and 4′,6-diamidino-2-phenylindole (DAPI) from control mice and mice with severe EAE at the same lumbar location as shown in (a) [18]. These maps reveal patterns of axonal injury, myelin loss, and inflammatory cells in spinal-cord white matter of mice with severe EAE. The color code in these images indicates the area fraction of positive staining, with red indicating the highest levels of staining. (c) Pixel-by-pixel correlations between DTI markers and clinical scores. In most white-matter regions of the mouse lumbar spinal cord, axial diffusivity and RA were significantly correlated with clinical score, whereas radial diffusivity was not [18]. Adapted, with permission, from [18].

