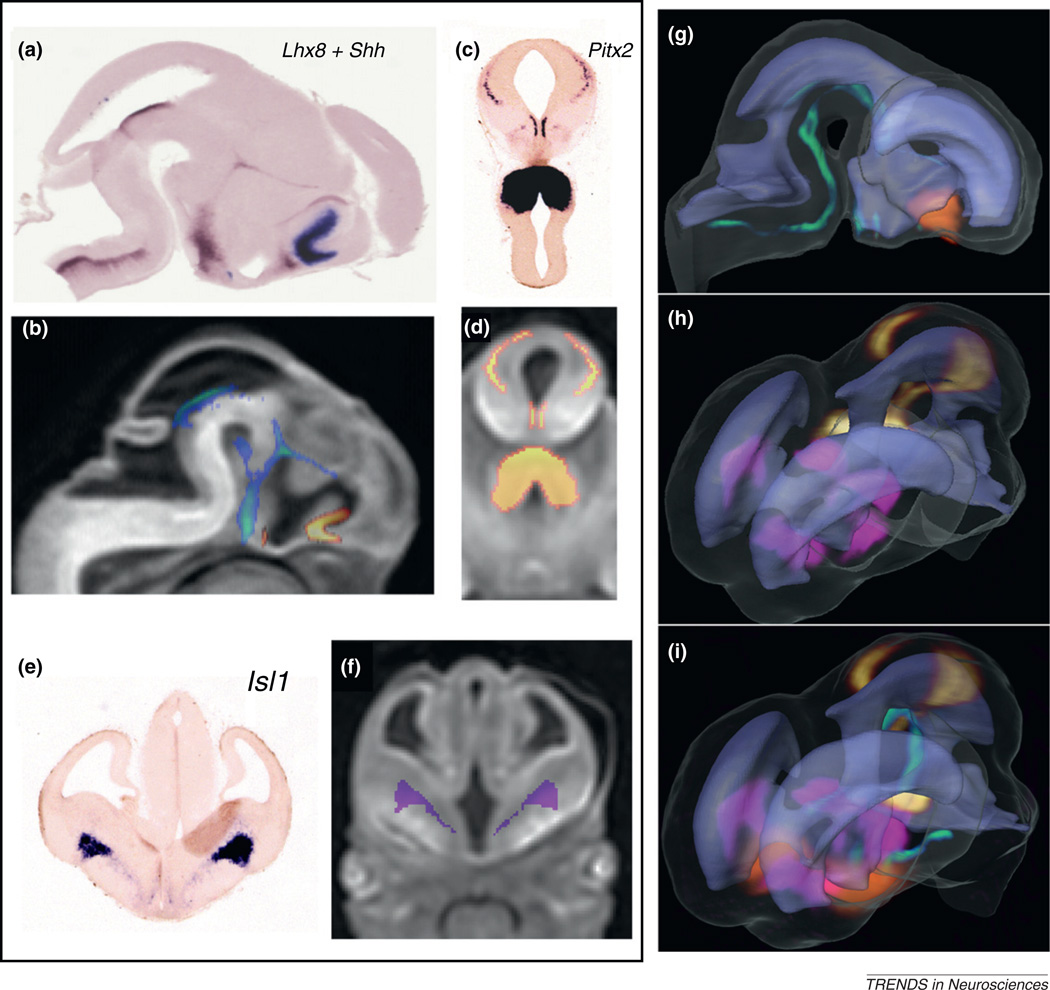
Figure 6.
Mapping of gene expression data to 3D DTI images in an E12 mouse embryo. Expression data for (a) LIM homeobox 8 (Lhx8) and Shh from serial sagittal ISH sections and (c) pituitary homeobox 2 (Pitx2) and (e) LIM homeobox 1 (Isl1) from serial coronal sections were mapped to (b,d,f) MR images using intensity- and landmark-based registration [16]. (g,h,i) Mapping of the expression data allowed visualization of the 3D expression patterns of Lhx8 (orange in g and i), Shh (green in g and i), Pitx2 (yellow in h and i), and Isl1 (pink in h and i), and their relative spatial distributions in the embryonic brain in relation to anatomical structures such as the ventricles (rendered in light purple). Adapted, with permission, from [16].

