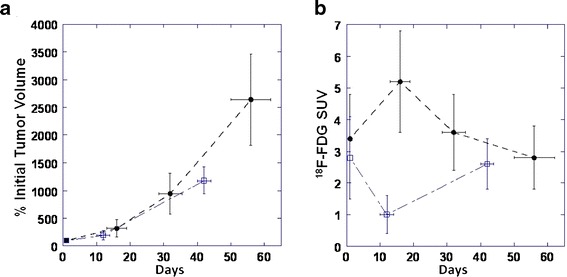
Fig. 6.

Quantification of a tumor growth expressed as % initial tumor volume and b 18F-FDG SUV over time (days post initial initiation of therapy) in Wt1-Igf2 mice treated with MEK inhibitor UO126 (open squares) and control littermate mice receiving saline (filled circles).
