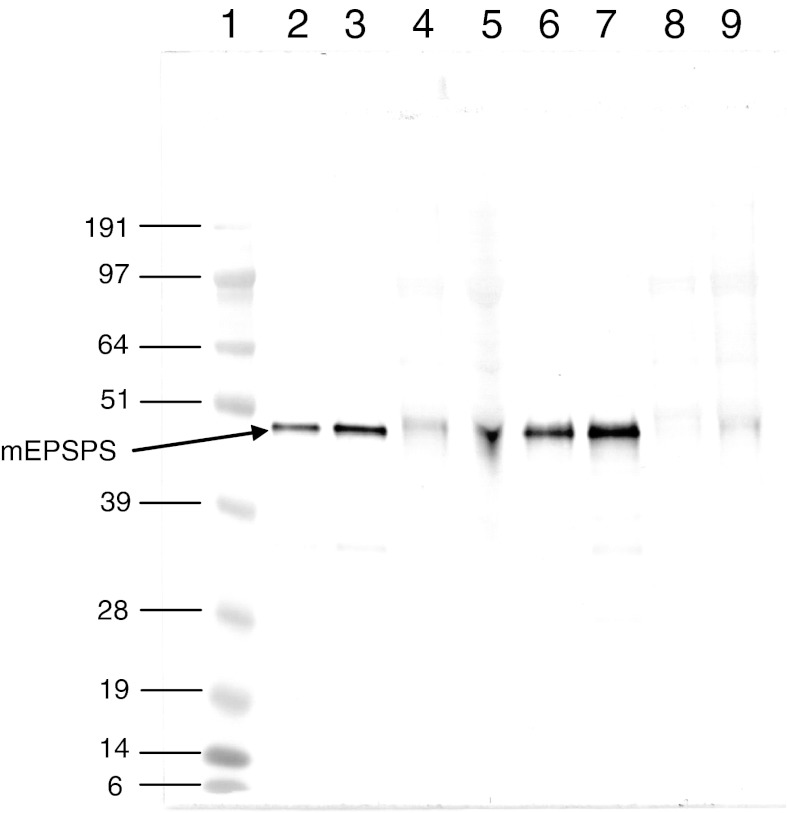
Fig. 2.
Western blot analysis of mEPSPS from recombinant E. coli and from transgenic maize. Lane 1 Molecular weight standard SeeBlue®Plus2 (Invitrogen; bands indicated as kDa); lanes 2 and 3 7.5 and 15 ng mEPSPS microbial mEPSPS, respectively; lanes 4 and 5 7.5 and 15 ng mEPSPS from GA21 maize (crude extract), respectively; lanes 6 and 7 7.5 and 15 ng mEPSPS from GA21 maize (purified using immunoaffinity chromatography), respectively; lanes 8 and 9 3.5 and 6.9 μg total protein from non-transgenic maize, respectively. The molecular weight of mEPSPS corresponds to about 47.4 kDa

