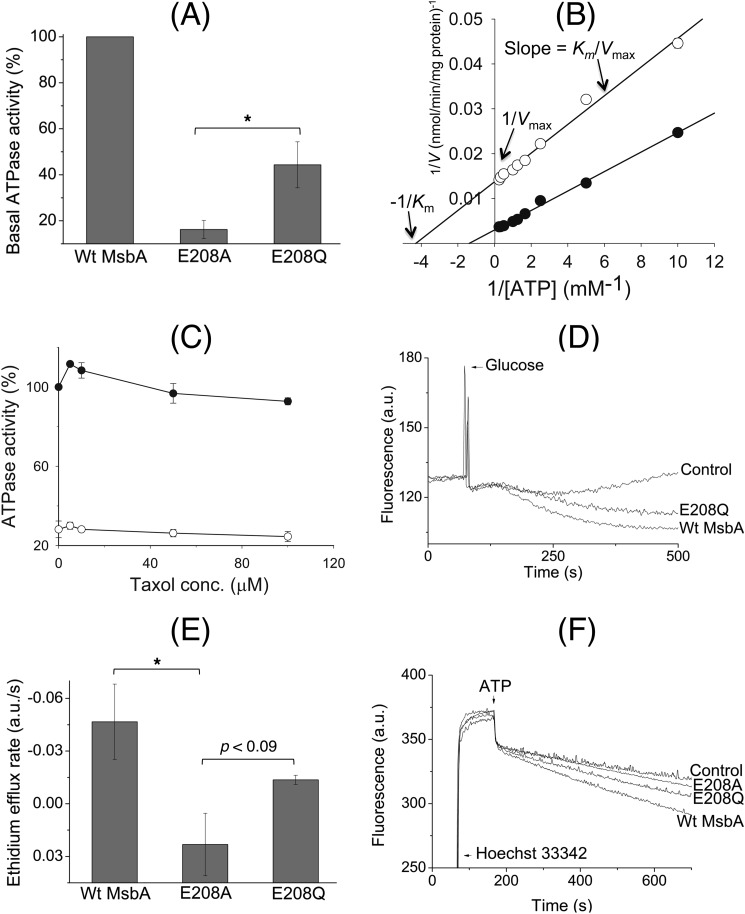
FIGURE 6.
E208Q mutation partially restores reduced catalytic activity of the E208A mutant. A, although the basal ATP hydrolysis activity of E208A MsbA at 1 mm ATP was reduced to 16.2 ± 3.9% of WT MsbA, E208Q MsbA was able to improve this performance to 44.4 ± 10.0% (100% activity of WT in these experiments equaled 158.5 ± 37.3 nmol ATP/min/mg) (n = 3; *, p < 0.05, Student's t test E208A mutant versus E208Q mutant). B, measurement of the basal ATP hydrolysis activity (n = 3) of detergent-purified WT MsbA (●) and E208A MsbA (○) over a range of ATP concentrations between 0.1 and 4 mm, and display of the data in a Lineweaver-Burk plot, revealed changes in the maximum rate of hydrolysis (Vmax) and Michaelis constant (Km) for E208A MsbA compared with WT MsbA, whereas the Vmax/Km ratio (= 1/slope) was relatively similar. See text for further details. C, inclusion of the MsbA substrate Taxol (32) stimulated the ATPase activity for WT MsbA but not for E208A MsbA. Experimental conditions and 100% value are as given in A, and symbols are as given in B. D, under conditions identical to those described for Fig. 3B, the E208Q mutant mediated the export of ethidium from intact cells. E, initial rates of ethidium efflux were measured over the first 50 s after the addition of glucose. These analyses showed that although E208Q MsbA could not efflux as well as the WT protein, its ethidium extrusion rate was significantly higher than that for E208A MsbA (WT versus E208A MsbA, *, p < 0.05; E208A MsbA versus E208Q MsbA, p < 0.09, Student's t tests). F, E208Q mutation improved Hoechst 33342 transport by MsbA in ISOVs compared with the E208A replacement. Experimental details are similar to those described in the legend to Fig. 3A. Consistent with ethidium transport measurements and ATPase assays, E208Q MsbA was never as efficient as WT MsbA. Traces in D and F and rates in E are based on observations in at least three independent experiments. Error bars represent mean ± S.E.

