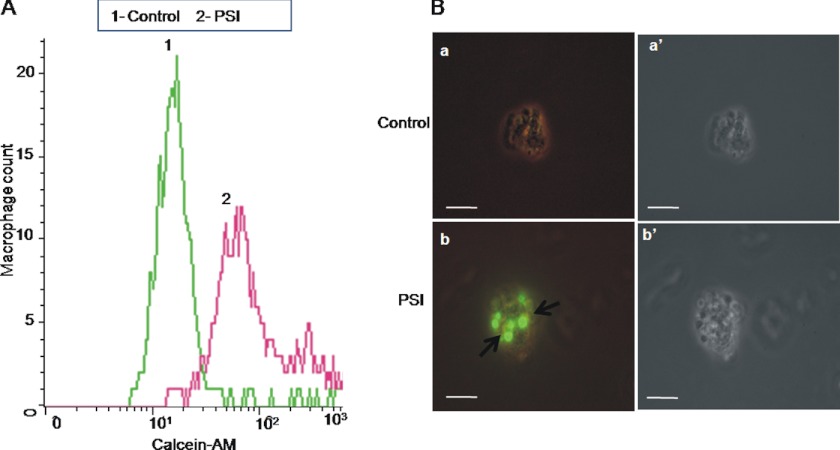
FIGURE 5.
Phagocytic uptake of platelets by autologous macrophages. A, flow cytometry of macrophages co-incubated with calcein-labeled platelets pretreated either with PSI (20 μm) or DMSO (control). B, epifluorescence microscopy of macrophages co-incubated with platelets pretreated either with DMSO (a) or PSI (20 μm) (b). Panels a′ and b′ represent corresponding phase-contrast micrographs. Scale bars, 10 μm. Data are representative of five different experiments.

