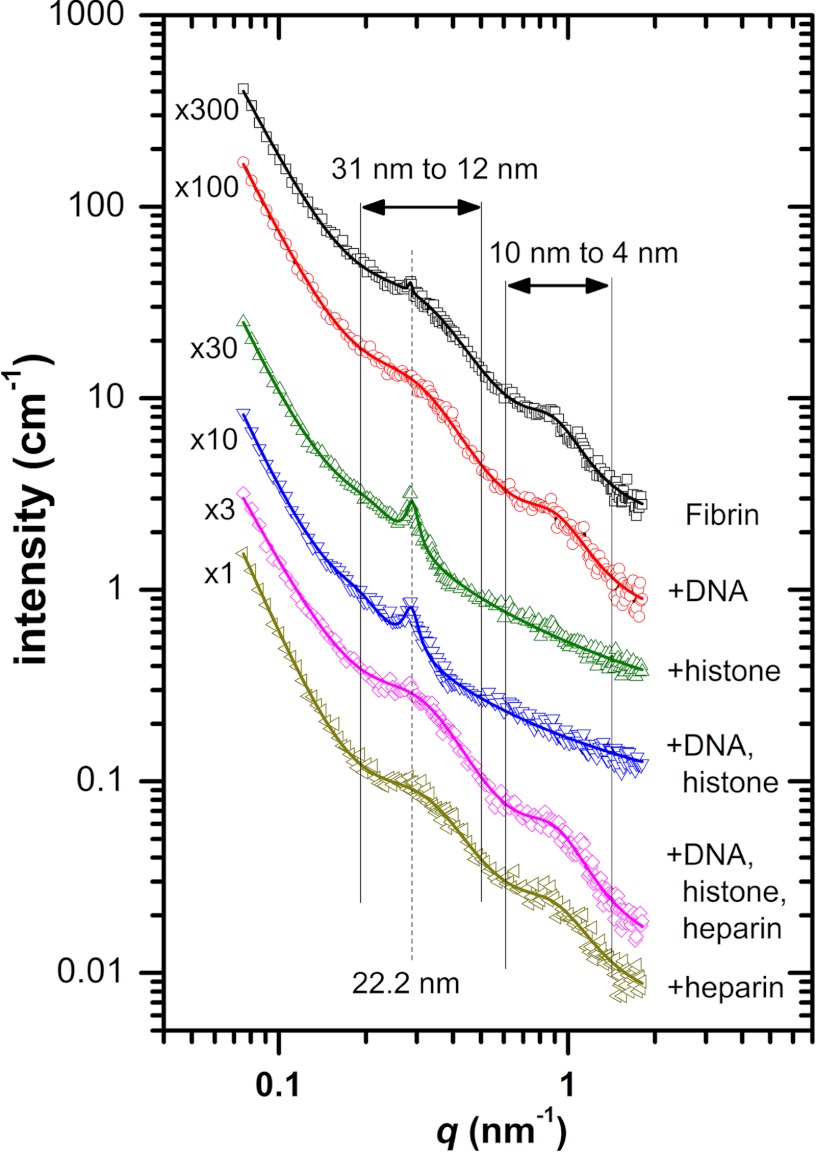
FIGURE 2.
Small angle x-ray scattering of fibrin clots containing 100 μg/ml DNA, 300 μg/ml histone, 10 IU/ml heparin, or their combinations at the same concentrations. Curves are shifted vertically by the factors indicated at their origin for better visualization. Symbols represent the measured intensity values, and solid lines show the fitted empirical functions as described in the supplemental table. The dashed vertical line indicates the longitudinal periodicity of about 22 nm, and the solid vertical lines show the boundaries of the broad peaks that characterize the lateral structure of the fibrin fibers.

