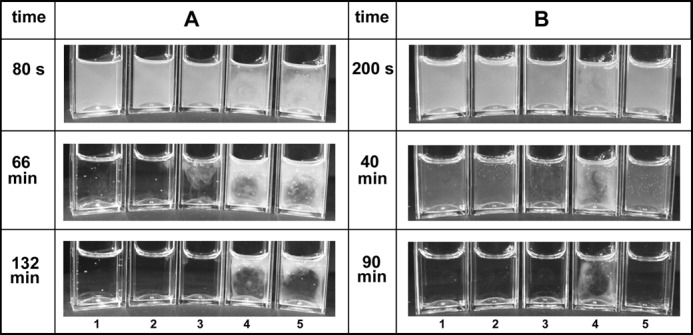
FIGURE 5.

Effects of DNA and histones on appearance of fibrin clots and rates of lysis. Clot lysis was monitored in the presence of (final concentrations) 1.4 mg/ml fibrinogen and 200 nm plasminogen clotted with 30 nm thrombin in the presence of 0.2 nm tPA. Tubes in positions 1–5 have the following additions: none, 50 μg/ml histones, 70 μg/ml DNA, DNA + histones, DNA + histones + 5 units/ml DNase I, respectively. In A, the DNase was separated from the DNA until clotting was initiated, and in B, the DNA solution was pretreated with DNase I for 30 min before clotting. The reaction was monitored for 3 h during which 2000 pictures were taken to form a time lapse video (supplemental Videos 1 and 2). The images shown here were selected at the times given to illustrate significant stages of the reaction.
