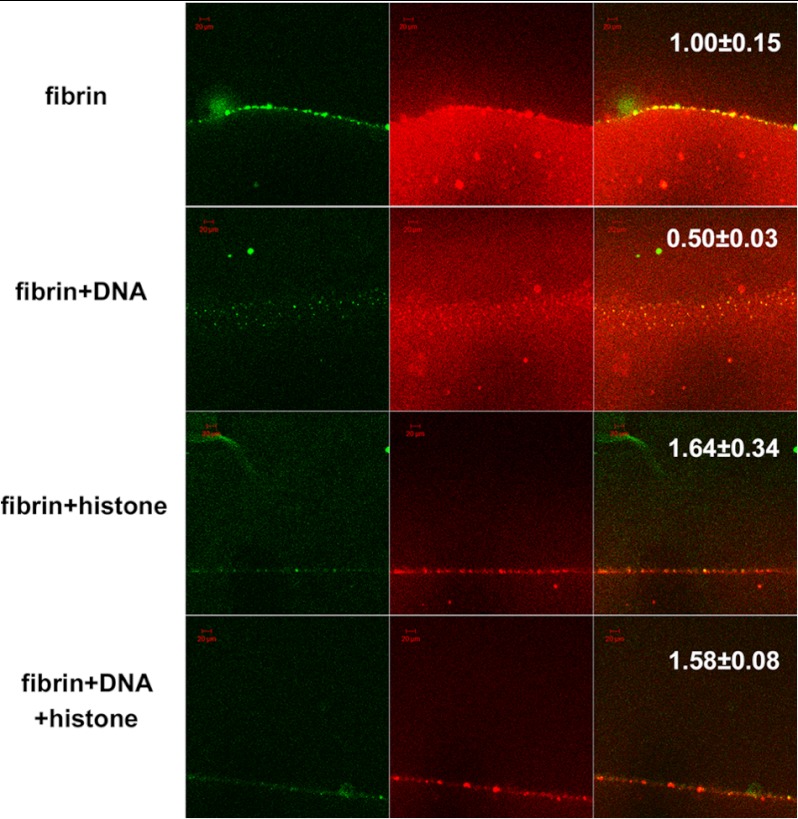
FIGURE 6.
Confocal microscopy studies using tPA-GFP and red fluorescent fibrin after 25 min of fibrinolysis. Each column of micrographs from left to right shows green tPA-GFP fluorescence, red Alexa Fluor 546-conjugated fibrin fluorescence, and the merged image. The first row shows the accumulation of fibrin aggregates that co-localize with tPA-GFP. The second row with the addition of 70 μg/ml DNA shows less fibrin aggregate formation but a diffuse fibrin clot that remains behind the advancing tPA-GFP front. The lower two rows where clots contain 50 μg/ml histones and 50 μg/ml histones + 70 μg/ml DNA, respectively, demonstrate reduced formation of fibrin aggregates within fibrin and less binding of tPA-GFP. The numbers in the last column indicate the relative distance for penetration of tPA-GFP in the clot at 25 min (the mean value for pure fibrin is 1, mean and S.E. from at least six samples, p < 0.05 for all additives according to the Kolmogorov-Smirnov test in comparison with pure fibrin). Scale bars, 20 μm.

