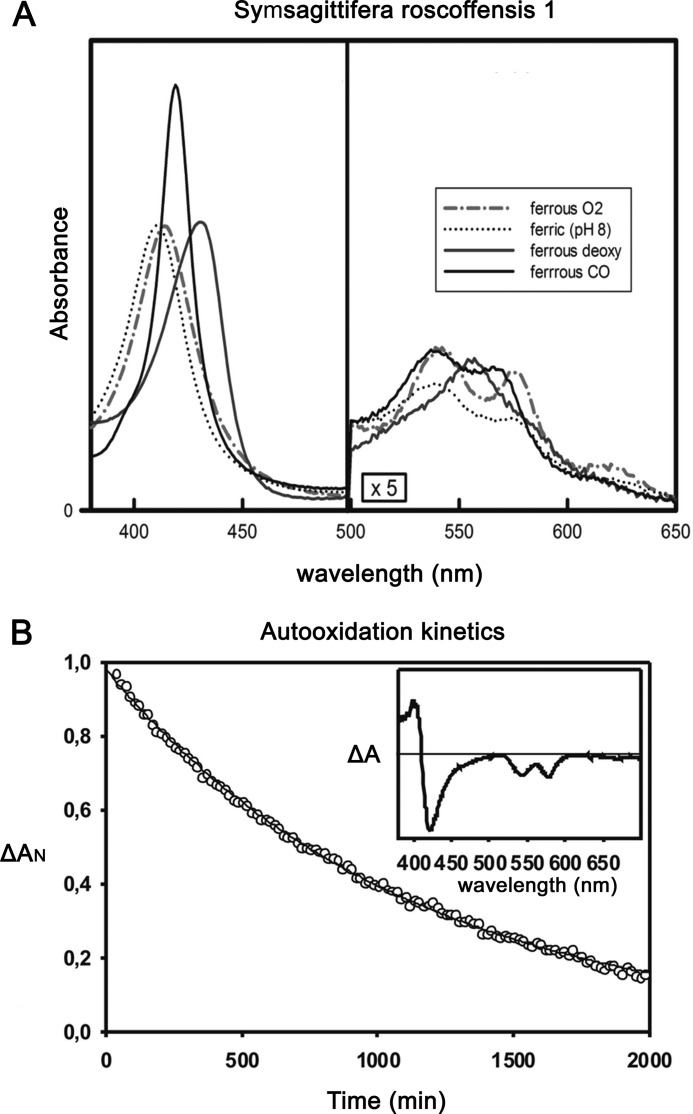
FIGURE 2.
A, UV and visible spectra for SrNgb1. Inset, partially oxygenated spectrum measured under an oxygen tension of 10 Torr. The dashed lines refer to the maximum absorption for the full oxy and deoxy spectra. B, autoxidation of SrNgb1 in 50 mm Tris-HCl, 0.2 mm EDTA, 10 units superoxide dismutase, and catalase at pH 8.0 under 1 atmosphere of O2 at 25 °C.

