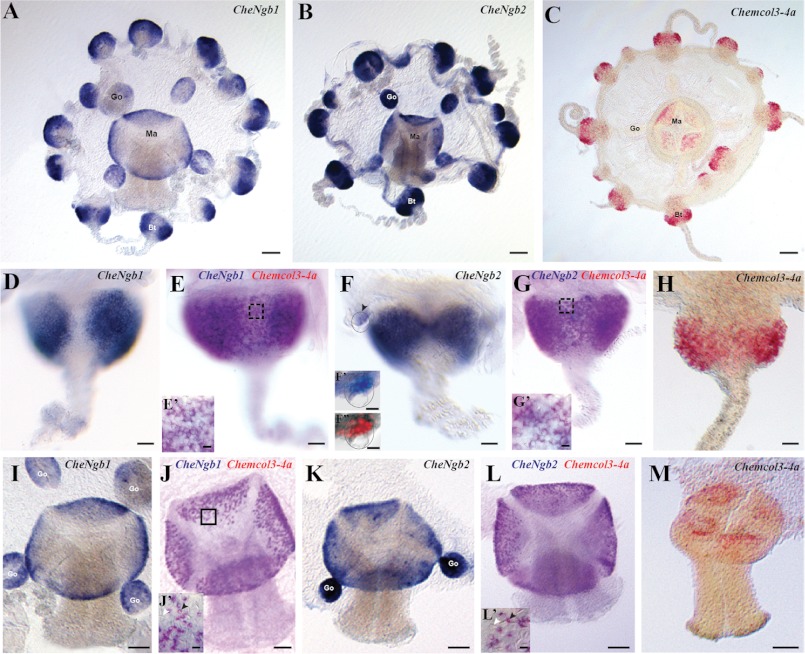
FIGURE 4.
Expression patterns of the two Clytia globin genes CheNgb1 and CheNgb2. A–C, whole mount in situ hybridizations for CheNg1, CheNg2 (blue = NBT/BCIP development) and Chemcol3–4a (red = fast red development) are shown. D–H, all bulbs have the same orientation, proximal area on the top and tentacle on the bottom. Crescent-shaped expression patterns are in the ectodermal layer of a tentacle bulb. All patterns are interrupted on the external side of the bulb, but sometimes the continuity of the staining on the inner face is visible (E and G). E and G, purple staining indicates expression of two genes. In each case, minicollagen 3-4a staining was revealed first with fast red, and then the other probe was revealed using NBT/BCIP. E′ and G′, details show staining in nematoblasts (black arrowhead). F′ and F″, higher magnification of a statocyst is delimited by the dotted circle. In situ hybridization (in black and white) and DAPI counterstaining (in red) merged after conversion of the in situ staining in gray scale. I–M, gene expression shown in the manubrium views (mouth on the bottom). The signal is concentrated in the ectoderm layer at the base of the manubrium. J′ and L′, detailed views show double-stained cells corresponding to nematoblasts (black arrowhead). Note that there is no signal in mature nematocytes (white arrowhead). go, gonad; ma, manubrium; tb, tentacle bulb. Scale bars: 100 μm (A–C); 25 μm (D–H), 50 μm (I–M), 5 μm (E′, G′, J′, L′), 10 μm (F′ and F″).

