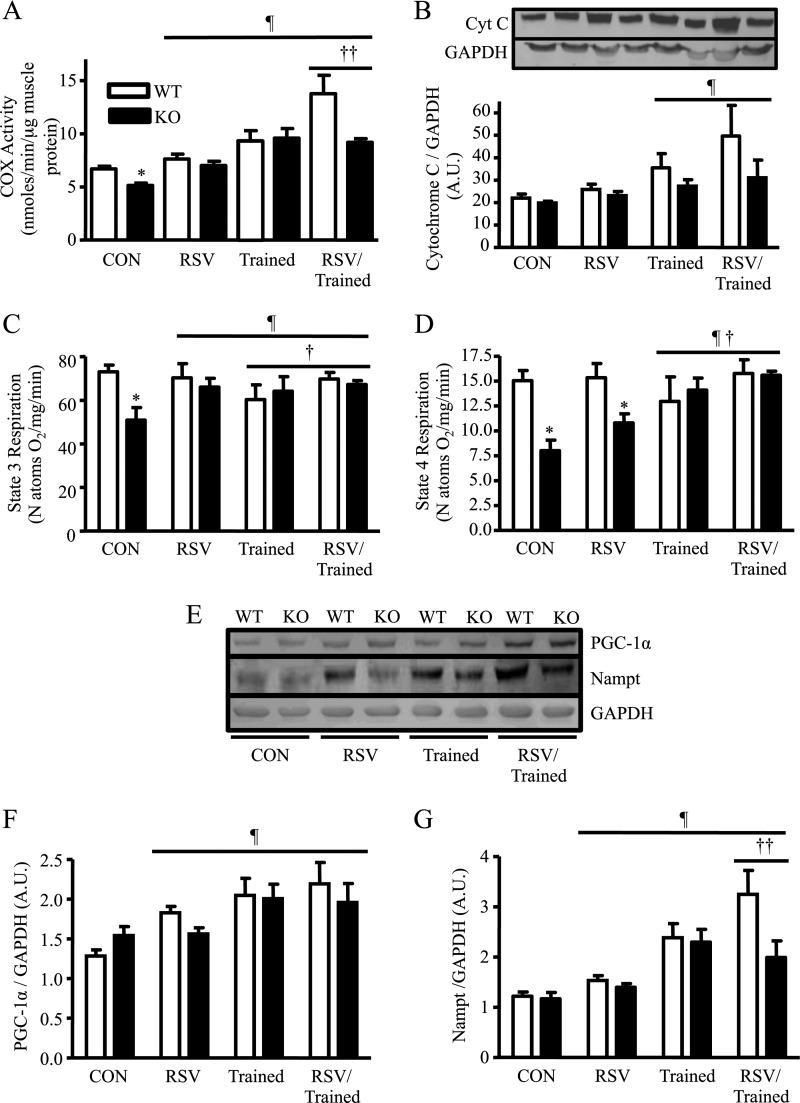
FIGURE 5.
A, skeletal muscle COX activity following training, RSV, and combined treatments in skeletal muscle from WT and SirT1-KO mice. B, cytochrome c (Cyt C) protein expression. C and D, state 4 and state 3 respirations/nanoatom oxygen consumed in subsarcolemmal mitochondria. E, PGC-1α and Nampt protein expression following training, RSV, and combined treatments in skeletal muscle from WT and SirT1-KO mice. F, and G, PGC-1α and Nampt protein expression is shown graphically (n = 7–12, arbitrary scanner units (A.U.) corrected for loading using GAPDH; ¶, p < 0.05, overall effect of each treatment under the line versus control; *, p < 0.05, versus control (Con) WT mice; †, p < 0.05, interaction of each treatment under the line versus control; ††, p < 0.05, interaction of RSV/Trained versus the trained mouse).

