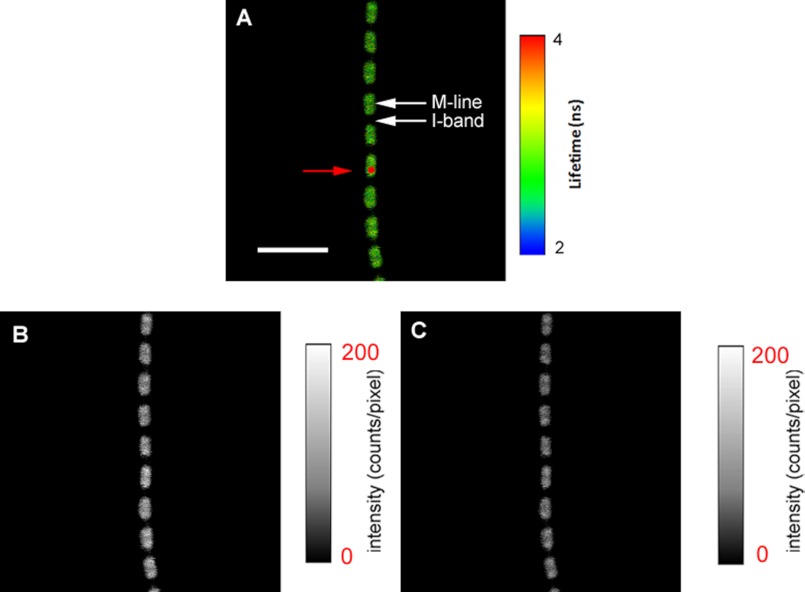
FIGURE 3.
A, fluorescence lifetime image of a relaxed myofibril. The red circle is a projection of the confocal aperture on the sample plane (diameter 0.5 μm). The lifetime scale is at the right. B, intensity image obtained with the direction of polarization of emitted light parallel (‖I‖) to the myofibrillar axis. C, intensity image obtained from the emission of fluorescence polarized perpendicular (‖I⊥) to the myofibrillar axis. The intensity scales are in counts per pixel. Native myofibrillar LC1 was exchanged with 10 nm SeTau-LC1. Scale bar = 5 μm, sarcomere length = 2.1 μm. Images were acquired by a PicoQuant Micro Time 200 single molecule confocal lifetime microscope. The sample was excited with a 635-nm pulsed laser and observed through a LP 650-nm filter.

