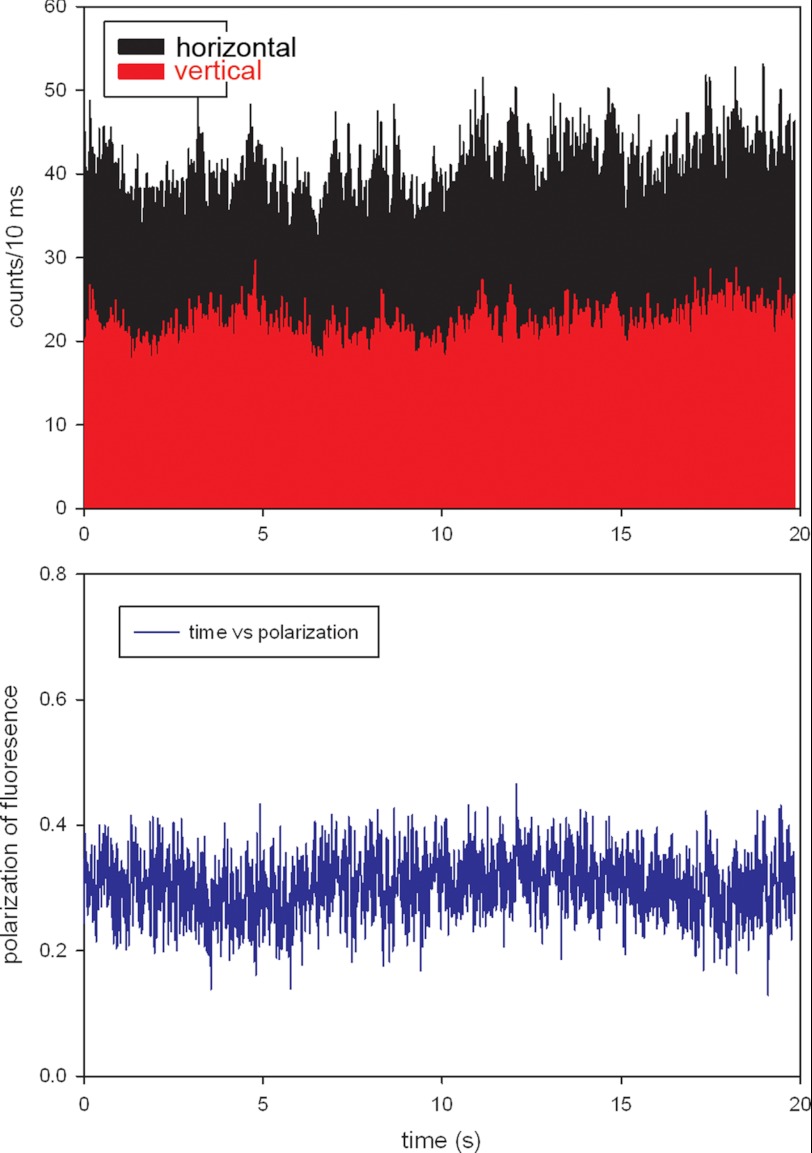
FIGURE 4.
Typical time course of polarized light of relaxed phosphorylated psoas muscle myofibril. The bar plot shows that the vertical scale is the number of counts during 10 ms. Ch2 (black, horizontal polarization) and Ch3 (red, vertical polarization) are fluorescence intensities polarized parallel (I‖) and perpendicular (I⊥) and to the myofibrillar axes, respectively. The direction of the excitation polarization is ‖ to the myofibrillar axis. The bottom panel shows corresponding polarization of fluorescence. Laser power = 0.3 μW.

