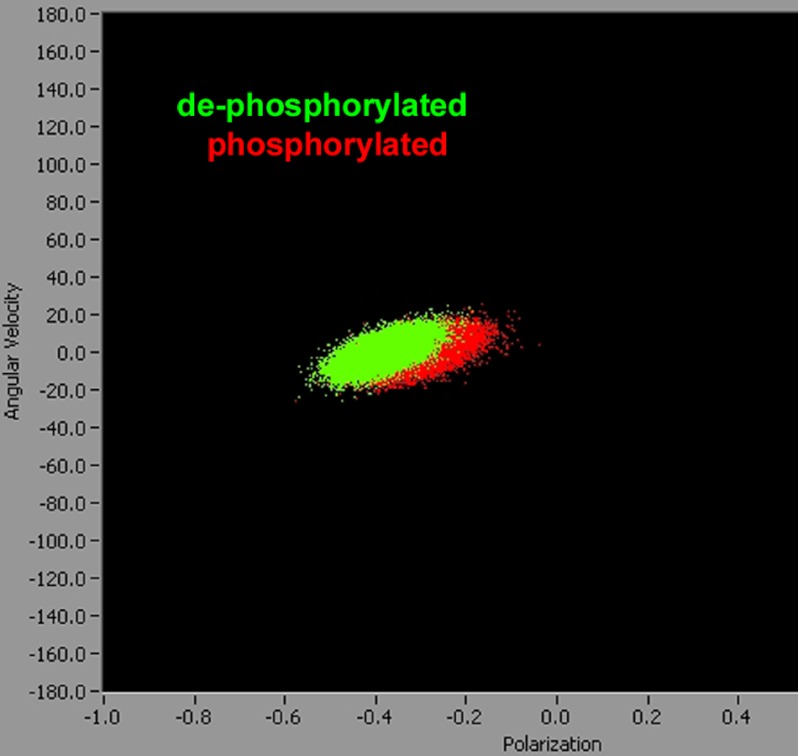
FIGURE 6.
The change of PF in 10 ms plotted versus the entire 80,000 values of PF obtained from relaxed dephosphorylated (green) and phosphorylated (red) muscle. It can be seen that the points from the dephosphorylated muscle are more narrowly distributed than points from phosphorylated muscle, and that phosphorylation decreases the mean polarization. Note that the horizontal scale shows −PF.

