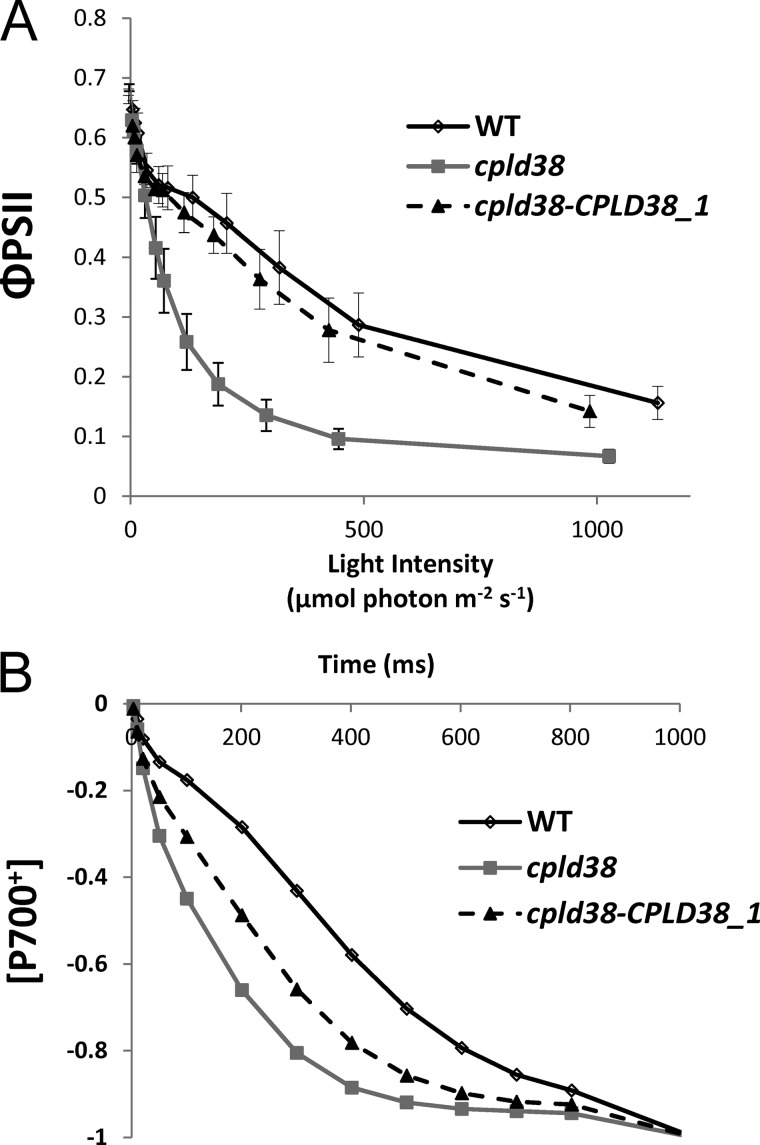
FIGURE 3.
Measurements of photosynthetic electron flow in WT, the cpld38 mutant, and the rescued mutant cpld38-CPLD38_1. A, efficiency of light-driven electron transport through PSII measured as the fluorescence parameter ΦPSII (FM′ − Ft′)/FM′). Cells were illuminated with actinic light at intensities indicated on the x axis for 1 min. B, rate of P700+ oxidation. Lower values on the y axis represent a greater proportion of oxidized P700. The inhibitors of PSII, DCMU, and hydroxylamine were added at concentrations of 10 μm and 1 mm, respectively. For all experiments, values on the y axis are the average of three measurements (technical replicates). Experiments were repeated with a biological replicate (data not shown), which gave nearly identical results. Error bars in A represent the standard deviation. Errors bars are not shown in B, but each data point in the displayed figure does not deviate from any of the individual replicates by more than 5% of the maximum value.

