
FIGURE 6.
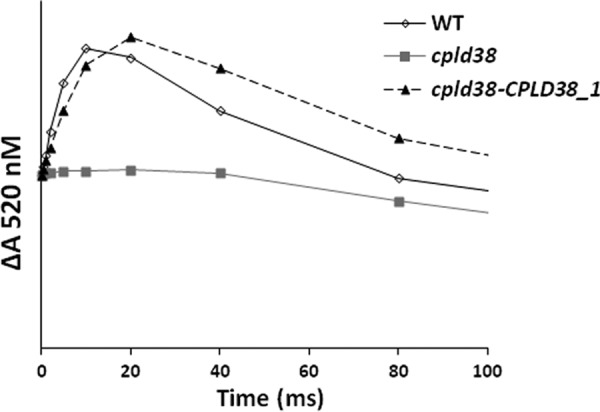
Measurements of cytochrome b6f complex activity by monitoring electrochromic absorption changes at 520 nm. Cells were incubated under moderately reducing conditions (unperturbed for 30 min in dark) to reduce cytochrome bh. Following this incubation, samples were excited with a saturating light pulse from an Nd:YAG laser to induce a single electron turnover. The PSII inhibitors DCMU and hydroxylamine were added at concentrations of 10 μm and 1 mm, respectively. The increase in absorption observed in the first 20 ms (excluding the value at time 0) corresponds to a charge separation within the cytochrome b6f complex. The traces are the average of three replicates with each data point in the displayed figure not deviating from any of the individual replicates by more than 5% of the maximum value. Samples were taken for measurement when the strains were in their exponential growth phase in low light (40 μmol photons m−2 s−1) on TAP media with moderate shaking (150 rpm).