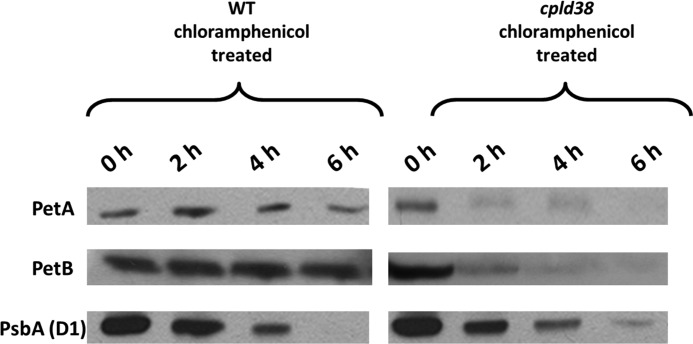
FIGURE 7.
Turnover of cytochrome f, cytochrome b6, and PsbA in thylakoid membranes. Following exposure of cells to chloramphenicol for the times indicated in the figure, total Chlamydomonas protein from WT and cpld38 mutant cells was fractionated by SDS-PAGE on a 15% polyacrylamide gel and detected immunologically. The antibodies used for this analysis are to polypeptides indicated on the left side of the figure. The 0-h time points were normalized to the cytochrome f intensities.

